








|
End-of-day quote
Buenos Aires S.E.
30/10/2026
|
5-day change | 1st Jan Change | ||
| 11,810.00 ARS | +2.70% |
|
+2.07% | -5.82% |
| 10-30 | Communications Services Tick Lower as Defensive Carriers Rise - Communications Roundup | DJ |
| 10-30 | Grupo Televisa says AT&T Mexico deal will strengthen its position | RE |
Business description: AT&T Inc.

- mobile telephony;
- fixed telephony and cable services: local and long-distance telephony services. The group also offers broadband Internet access, e-mail, and satellite television.
Net sales break down by source of income between sales of services (80.5%), and sales of equipment (19.5%).
Net sales are distributed geographically as follows: the United States (95.7%), Mexico (3.5%), Europe (0.3%), Asia-Pacific (0.3%), Latin America (0.1%) and other (0.1%).
Number of employees: 133,030
Sales by Activity: AT&T Inc.
| Fiscal Period: December | 2021 (USD) | 2022 (USD) | 2023 (USD) | 2024 (USD) | 2025 (USD) |
|---|---|---|---|---|---|
Communications - Mobility | 78.25B | 81.78B | 83.98B | 85.26B | 89.48B |
Latin America | 2.75B | 3.14B | 3.93B | 4.23B | 4.38B |
Communications - Business Wireline | 23.94B | 22.54B | 20.88B | 18.82B | 17.23B |
Communications - Consumer Wireline | 12.54B | 12.75B | 13.17B | 13.58B | 14.18B |
Unallocated Value Portfolio | - | 489M | 380M | 338M | 259M |
Unallocated Securitization Fees | - | 65M | 85M | 116M | 115M |
Unallocated DTV-Related Retained Costs | - | 8M | - | - | - |
Eliminations and Consolidations | -3.63B | - | - | - | - |
Corporate | 1.26B | - | - | - | - |
Unallocated Parent Administration Support | - | -32M | -7M | -2M | -1M |
Video | 15.51B | - | - | - | - |
Latin America - Vrio | 2.61B | - | - | - | - |
Warnermedia | 35.63B | - | - | - | - |
Geographical breakdown of sales: AT&T Inc.
| Fiscal Period: December | 2021 (USD) | 2022 (USD) | 2023 (USD) | 2024 (USD) | 2025 (USD) |
|---|---|---|---|---|---|
United States | 152B | 116B | 117B | 117B | 120B |
Mexico | 3.04B | 3.21B | 3.99B | 4.29B | 4.43B |
Asia/Pacific Rim | 2.64B | 592M | 521M | 462M | 395M |
Europe | 6.08B | 584M | 504M | 441M | 382M |
Other | 870M | 132M | 119M | 116M | 114M |
Latin America | - | 217M | 194M | 149M | 110M |
All Other Latin America | 3.12B | - | - | - | - |
Brazil | 1.49B | - | - | - | - |
Executive Committee: AT&T Inc.
| Manager | Title | Age | Since |
|---|---|---|---|
John Stankey
CEO | Chief Executive Officer | 63 | 30/06/2020 |
Pascal Desroches
DFI | Director of Finance/CFO | 62 | 31/03/2021 |
Jeremy Legg
CTO | Chief Tech/Sci/R&D Officer | 57 | 21/04/2022 |
| Chief Operating Officer | 55 | 21/04/2022 | |
Brett Feldman
IRC | Investor Relations Contact | - | 31/12/2023 |
Composition of the Board of Directors: AT&T Inc.
| Director | Title | Age | Since |
|---|---|---|---|
Matthew Rose
BRD | Director/Board Member | 66 | 23/09/2010 |
| Director/Board Member | 73 | 31/01/2013 | |
Cynthia Taylor
BRD | Director/Board Member | 64 | 27/06/2013 |
Beth Mooney
BRD | Director/Board Member | 71 | 26/09/2013 |
William Kennard
CHM | Chairman | 69 | 20/01/2021 |
John Stankey
CHM | Chairman | 63 | 13/02/2025 |
Stephen Luczo
BRD | Director/Board Member | 69 | 31/10/2019 |
Luis Ubiñas
BRD | Director/Board Member | 63 | 24/06/2021 |
Marissa Mayer
BRD | Director/Board Member | 50 | 29/02/2024 |
Kelly Grier
BRD | Director/Board Member | 58 | 31/08/2025 |
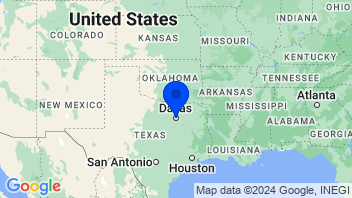
Company details: AT&T Inc.
Group companies: AT&T Inc.
| Name | Category and Sector |
|---|---|
GigaPower LLC | |
AT&T Global Network Services Hong Kong Ltd. | |
AT&T Telecom Holdings S de Rl de CV | |
TT Games Ltd.
 TT Games Ltd. Packaged SoftwareTechnology Services Develops video games and traveler tales publishing |
Packaged Software
|
Warner Bros. Entertainment UK Ltd.
 Warner Bros. Entertainment UK Ltd. Movies/EntertainmentConsumer Services Provides film distribution and entertainment show production services |
Movies/Entertainment
|
Other Wireless Telecommunications Services
| Change | 5-day change | 1-year change | 3-year change | Capi.($) | ||
|---|---|---|---|---|---|---|
 | -6.37% | -8.66% | - | - | 1,830B | |
| -5.96% | +4.79% | -31.85% | +193.07% | 162B | |
| +6.21% | +6.76% | -25.73% | +10.50% | 166B | |
| +2.34% | +2.29% | -13.25% | +40.30% | 144B | |
| -0.20% | +4.23% | -4.65% | +112.77% | 129B | |
| +4.27% | +2.34% | -15.01% | -42.60% | 82.45B | |
| +0.64% | -1.35% | +7.19% | +39.32% | 71.3B | |
| +2.11% | -1.01% | +15.54% | +28.32% | 68.56B | |
| +2.01% | +0.76% | +30.42% | +55.22% | 36.74B | |
| Average | +0.36% | +1.13% | -4.67% | +54.61% | 298.91B | |
| Weighted average by Cap. | +0.74% | -4.84% | -12.18% | +65.90% |
Sector

Trader
This super rating is the result of a weighted average of the rankings based on the following ratings: Valuation (Composite), EPS Revisions (4 months), and Visibility (Composite). We recommend that you carefully review the associated descriptions.
Investor
This super composite rating is the result of a weighted average of the rankings based on the following ratings: Fundamentals (Composite), Valuation (Composite), EPS Revisions (1 year), and Visibility (Composite). We recommend that you carefully review the associated descriptions.
Global
This composite rating is the result of an average of the rankings based on the following ratings: Fundamentals (Composite), Valuation (Composite), Financial Estimates Revisions (Composite), Consensus (Composite) and Visibility (Composite). The company must be covered by at least 4 of these 5 ratings for the calculation to be carried out. We recommend that you carefully review the associated descriptions.
Quality
This composite rating is the result of an average of rankings based on the following ratings: Returns (Composite), Profitability (Composite) and Quality of Financial Reporting (Composite), and Financial Health (Composite). The company must be covered by at least 2 of these 3 ratings for the calculation to be performed. We recommend that you carefully read the associated descriptions.
ESG MSCI
The MSCI ESG score assesses a company’s environmental, social, and governance practices relative to its industry peers. Companies are rated from CCC (laggard) to AAA (leader). This rating helps investors incorporate sustainability risks and opportunities into their investment decisions.


Quarterly revenue - Rate of surprise


- Stock Market
- Stocks
- T Stock
- T Stock
- Company AT&T Inc.
Select your edition
All financial news and data tailored to specific country editions


