







GlaxoSmithKline plc Share Price LIQUIDNET SYSTEMS
Stocks
GSK
GB0009252882
Pharmaceuticals
OTC Markets Traded|
Delayed
Other stock markets
|
5-day change | 1st Jan Change | ||
| - EUR | -.--% |
|
-0.40% | - |
| Market Cap | 74.95B 101B 88.16B 81.49B 141B 9,700B 144B 974B 382B 4,746B 378B 369B 16,351B | P/E 2026 * |
11.9x | P/E 2027 * | 10.9x |
|---|---|---|---|---|---|
| Enterprise Value | 90.66B 122B 107B 98.58B 171B 11,733B 174B 1,179B 462B 5,741B 457B 447B 19,778B | EV / Sales 2026 * |
2.67x | EV / Sales 2027 * | 2.46x |
| Free-Float |
92.29% | Yield 2026 * |
3.7% | Yield 2027 * | 3.89% |

Last Transcript: GlaxoSmithKline plc
| 11:27am | GSK : Deutsche Bank remains Neutral | ZD |
| 07-17 | GSK : Jefferies reiterates its Buy rating | ZD |
| 07-17 | GSK : JP Morgan maintains a Sell rating | ZD |
| 07-14 | Where would AI lead Pharma in the long run? |  |
| 07-13 | GSK : UBS remains Neutral | ZD |
| Manager | Title | Age | Since |
|---|---|---|---|
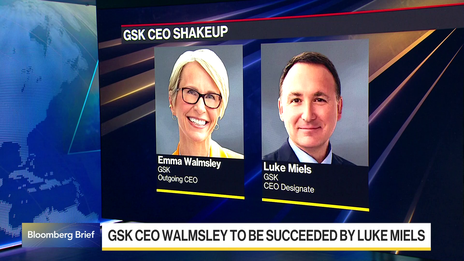
Luke Miels
CEO | Chief Executive Officer | - | 31/12/2025 |
Julie Brown
DFI | Director of Finance/CFO | 64 | 30/04/2023 |
| Chief Tech/Sci/R&D Officer | - | 30/11/2021 |
| Director | Title | Age | Since |
|---|---|---|---|
Luke Miels
BRD | Director/Board Member | - | 05/05/2026 |
Hal Barron
BRD | Director/Board Member | 64 | 31/12/2017 |
Jonathan Symonds
CHM | Chairman | 68 | 31/08/2019 |
| Change | 5-day change | 1-year change | 3-year change | Capi.($) | ||
|---|---|---|---|---|---|---|
 | -.--% | -0.40% | - | - | 103B | |
| -2.73% | -3.51% | +48.62% | +152.87% | 1,051B | |
| -1.67% | -3.18% | +52.00% | +56.75% | 609B | |
| -0.44% | +2.14% | +33.88% | +84.04% | 450B | |
| -0.75% | -1.46% | +28.32% | +22.33% | 330B | |
| -1.52% | -0.95% | +33.38% | +38.39% | 284B | |
| -1.70% | -3.54% | +20.26% | +17.88% | 263B | |
| -0.58% | +1.78% | -20.89% | -38.37% | 223B | |
| -0.58% | +0.21% | +23.55% | +56.94% | 198B | |
| -0.80% | +2.60% | +23.09% | +68.71% | 167B | |
| Average | -0.88% | +0.54% | +26.91% | +51.06% | 397.23B | |
| Weighted average by Cap. | -1.13% | +0.02% | +35.25% | +75.58% |
| 2026 * | 2027 * | |
|---|---|---|
| Net sales | 33.9B 45.5B 39.88B 36.86B 63.97B 4,388B 65B 441B 173B 2,147B 171B 167B 7,397B | 35.64B 47.83B 41.92B 38.75B 67.24B 4,612B 68.32B 463B 182B 2,257B 180B 176B 7,774B |
| Net income | 6.47B 8.68B 7.61B 7.03B 12.2B 837B 12.4B 84.09B 32.97B 410B 32.6B 31.88B 1,411B | 6.92B 9.29B 8.14B 7.53B 13.06B 896B 13.27B 90B 35.28B 438B 34.88B 34.12B 1,510B |
| Net Debt | 15.71B 21.08B 18.48B 17.08B 29.64B 2,033B 30.12B 204B 80.07B 995B 79.17B 77.44B 3,427B | 12.71B 17.06B 14.95B 13.82B 23.98B 1,645B 24.36B 165B 64.77B 805B 64.04B 62.65B 2,772B |



Trader
This super rating is the result of a weighted average of the rankings based on the following ratings: Valuation (Composite), EPS Revisions (4 months), and Visibility (Composite). We recommend that you carefully review the associated descriptions.
Investor
This super composite rating is the result of a weighted average of the rankings based on the following ratings: Fundamentals (Composite), Valuation (Composite), EPS Revisions (1 year), and Visibility (Composite). We recommend that you carefully review the associated descriptions.
Global
This composite rating is the result of an average of the rankings based on the following ratings: Fundamentals (Composite), Valuation (Composite), Financial Estimates Revisions (Composite), Consensus (Composite) and Visibility (Composite). The company must be covered by at least 4 of these 5 ratings for the calculation to be carried out. We recommend that you carefully review the associated descriptions.
Quality
This composite rating is the result of an average of rankings based on the following ratings: Returns (Composite), Profitability (Composite) and Quality of Financial Reporting (Composite), and Financial Health (Composite). The company must be covered by at least 2 of these 3 ratings for the calculation to be performed. We recommend that you carefully read the associated descriptions.
ESG MSCI
The MSCI ESG score assesses a company’s environmental, social, and governance practices relative to its industry peers. Companies are rated from CCC (laggard) to AAA (leader). This rating helps investors incorporate sustainability risks and opportunities into their investment decisions.


Quarterly revenue - Rate of surprise

- Stock Market
- Stocks
- GSK Stock
- GSK Stock
Select your edition
All financial news and data tailored to specific country editions


