“We finished 2023 with another strong quarter, achieving the top end of our increased annual guidance with record production of 529,300 ounces of gold. This represented a 15% increase from 2022, at lower costs, driving a record financial performance and strong free cash flow, all while continuing to invest in high-return, low-cost growth,” said
“We expect this strong performance to continue with growing production and declining costs over the next several years. Mulatos continues to outperform, supporting an increase in our 2024 production guidance. The Phase 3+ Expansion at Island Gold remains on track to deliver further production growth, decreasing costs, and substantial free cash flow growth into 2026 and beyond. We are advancing our other growth initiatives with the development plan for PDA expected to be completed later this quarter, outlining additional production upside as early as 2026, and with
Fourth Quarter and Full Year 2023 Operating Results
| Q4 2023 | Q4 2022 | 2023 | 2022 | 2023 Guidance | ||
| Gold production (ounces) | ||||||
| 49,800 | 44,600 | 185,100 | 192,200 | 185,000 – 200,000 | ||
| Island Gold | 31,600 | 40,500 | 131,400 | 133,700 | 120,000 – 135,000 | |
| 48,100 | 49,100 | 212,800 | 134,500 | 175,000 – 185,000 | ||
| Total gold production – Original guidance | 480,000 – 520,000 | |||||
| Total gold production – Revised guidance | 129,500 | 134,200 | 529,300 | 460,400 | 515,000 – 530,000 | |
- Record annual production; met top end of increased production guidance: produced a record 529,300 ounces, achieving the top end of revised guidance which had been increased 5% in
October 2023 . This included a strong finish to the year from all three operations with fourth quarter production of 129,500 ounces. Full year production increased 15% from 2022 driven by low-cost growth from LaYaqui Grande - Costs expected to meet 2023 guidance: total cash costs and all-in sustaining costs (“AISC”) for 2023 have not been finalized but are expected to be consistent with full year guidance. As previously guided, AISC are expected to be above full year guidance in the fourth quarter, but in-line with guidance on a full year basis
- Record financial performance: sold 129,005 ounces of gold in the fourth quarter at an average realized price of
$1,973 per ounce for revenues of$255 million . Full year sales totaled 526,257 ounces of gold at an average realized price of$1,944 per ounce for record revenues of$1.0 billion - Growing cash position: ended the year with approximately
$225 million of cash and cash equivalents, up from$130 million at the end of 2022 reflecting strong free cash flow generation through the year. The Company remains debt-free
Three Year Guidance Overview: Operating Mines1
| 2024 | 2025 | 2026 | |||
| Current | Previous | Current | Previous | Current | |
| Total Gold Production (000 oz) | 485 - 525 | 470 - 510 | 470 - 510 | 470 - 510 | 520 - 560 |
| Total Cash Costs(1) ($/oz) | |||||
| All-in Sustaining Costs(1),(2) ($/oz) | |||||
| Total sustaining & growth capital(1),(3) (Operating mines; ex. Exploration, | |||||
(1) Refer to the “Non-GAAP Measures and Additional GAAP” disclosure at the end of this press release for a description of these measures.
(2) All-in sustaining cost guidance for 2025 and 2026 includes the same assumptions for G&A and stock based compensation as included in 2024.
(3) Sustaining and growth capital guidance is for producing mines and excludes capital for
- 2024 production guidance increased; 7% growth expected by 2026: production guidance increased to between 485,000 and 525,000 ounces in 2024, a 3% increase from previous guidance issued in
January 2023 driven by increased production from theMulatos District through residual leaching of the main leach pad. Production is expected to increase 7% by 2026 reflecting low-cost production growth from Island Gold with the completion of the Phase 3+ Expansion - PDA to provide additional upside potential in 2026 with further growth potential in 2027 through
Lynn Lake : three-year guidance excludes the higher-gradePuerto Del Aire (“PDA”) project, which represents potential production upside at Mulatos as early as 2026. This upside is expected to be outlined in a development plan for PDA to be completed in the first quarter of 2024, which will incorporate ongoing exploration success in 2023. Looking beyond 2026, theLynn Lake project is expected to support further potential growth with first production as early as the second half of 2027 - Total cash costs and AISC per ounce expected to remain flat in 2024 and decrease 15% and 11%, respectively, by 2026:
- Total cash costs of
$825 and$875 per ounce in 2024 are expected to be consistent with 2023, and decrease 15% by 2026 to$675 to$775 per ounce: costs are expected to decrease steadily into 2025 and 2026 reflecting the end of higher-cost residual leaching at Mulatos and low-cost production growth from Island Gold - Cost guidance for 2024 has increased from previous guidance primarily reflecting higher than previously guided production from the
Mulatos District , the stronger Mexican Peso, as well as ongoing inflation - The additional production from Mulatos is expected to come through residual leaching which carries higher reported costs, though is expected to provide strong free cash flow with the majority of these costs previously incurred. Excluding this impact and the stronger Mexican peso, total cash costs increased approximately 5% relative to previous guidance with the main driver being inflation
- AISC expected to be between
$1,125 to$1,175 per ounce in 2024, and decrease 11% by 2026 to$975 to$1,075 per ounce: consistent with total cash costs, the end of residual leaching at Mulatos and low-cost production growth from Island Gold is expected to drive a significant decrease in costs into 2025 and 2026
- Total cash costs of
- Capital spending expected to decrease 46% by 2026 at existing operations: total capital (excluding capitalized exploration) is expected to range between
$350 to$390 million in 2024, an increase from 2023 reflecting inflation, as well as higher spending at Island Gold andLynn Lake . This includes$325 to$365 million of capital at producing mines (excluding PDA andLynn Lake ). Capital spending for producing mines is expected to decrease slightly into 2025, followed by a substantial reduction in 2026 to$175 to$200 million reflecting the completion of the Phase 3+ Expansion. The total capital budget for 2024 includes:- Sustaining capital guidance of
$93 to$105 million: down from 2023 and expected to increase slightly in 2025 and 2026 - Growth capital guidance for producing mines of
$232 to$260 million: up from 2023 reflecting higher growth capital atYoung -Davidson and Island Gold. Growth capital is expected to decrease by nearly 70% in 2026 with the completion of the Phase 3+ Expansion
- Sustaining capital guidance of
- Exploration budget of
$62 million: up from expected spending of approximately$50 million in 2023. This represents the largest exploration budget in the history of the Company with expanded budgets across all key assets following up on broad based exploration success in 2023. This success was most notable at Island Gold and theMulatos District with both assets expected to account for approximately 60% of the total budget in 2024 - Strong ongoing free cash flow while funding low-cost growth: the Company expects to continue generating strong ongoing free cash flow at current gold prices while funding the Phase 3+ Expansion at Island Gold. Free cash flow generation from existing operations is expected to increase substantially in 2026 following the completion of the Phase 3+ Expansion, reflecting higher production, lower costs, and lower capital spending
(1) Guidance statements in this release are forward-looking information. See the Assumptions and Sensitives section of this release along with the cautionary note at the end of this release.
Upcoming 2024 catalysts
- PDA development plan: Q1 2024
- 2023 year-end Mineral Reserve and Resource update:
February 2024 - Island Gold and Mulatos exploration updates: ongoing
- Burnt Timber and Linkwood study (satellite deposits to
Lynn Lake ): Q4 2024
2024 Guidance
| 2024 Guidance | 2023 Guidance | ||||||||||
| Island Gold | Total | Total | |||||||||
| Gold production (000 oz) | 180 - 195 | 145 - 160 | 160 - 170 | 485 - 525 | 529 (actual) | ||||||
| Cost of sales, including amortization ($ millions)(2) | $620 | $625 | |||||||||
| Cost of sales, including amortization ($/oz)(2) | $1,225 | $1,250 | |||||||||
| Total cash costs ($/oz)(1) | - | ||||||||||
| All-in sustaining costs ($/oz)(1) | |||||||||||
| Mine-site all-in sustaining costs ($/oz)(1)(3) | - | ||||||||||
| Capital expenditures ($ millions) | |||||||||||
| Sustaining capital(1) | - | ||||||||||
| Growth capital(1) | - | ||||||||||
| - | |||||||||||
| Growth capital – development projects ($ millions) | $25 | $12 | |||||||||
| Capitalized exploration(1) ($ millions) | $41 | $25 | |||||||||
| Total capital expenditures and capitalized exploration(1) ($ millions) | $34 | ||||||||||
(1) Refer to the "Non-GAAP Measures and Additional GAAP" disclosure at the end of this press release for a description of these measures.
(2) Cost of sales includes mining and processing costs, royalties, and amortization expense, and is calculated based on the mid-point of total cash cost guidance.
(3) For the purposes of calculating mine-site all-in sustaining costs at individual mine sites, the Company does not include an allocation of corporate and administrative and share based compensation expenses to the mine sites.
Gold production in 2024 is expected to range between 485,000 and 525,000 ounces, a 3% increase from the previous three-year guidance provided in
Total cash costs and AISC are expected to be consistent with 2023. Costs are expected to be towards the upper end of guidance to start the year and trend lower through the year reflecting declining rates of production from residual leaching at Mulatos.
AISC guidance has increased 12% relative to previous guidance (based on the mid-point) with the majority related to the increase in production from the
The main driver of the increase in AISC is higher costs at the
Additionally, the stronger Mexican Peso of 17:1 (MXN:USD), compared to 20:1 in previous guidance, increased costs by approximately
(1) Refer to the “Non-GAAP Measures and Additional GAAP” disclosure at the end of this press release for a description of these measures.
(2) Total consolidated all-in sustaining costs include corporate and administrative and share based compensation expenses.
Capital spending is expected to increase from 2023 reflecting inflation, higher capital at Island Gold and
Given the strong profitability of the Mulatos operation in 2023, the Company expects to pay significantly higher cash tax payments in
2024 – 2026 Guidance: Operating Mines
| 2024 | 2025 | 2026 | |||
| Current | Previous | Current | Previous | Current | |
| Gold Production (000 oz) | |||||
| 180 - 195 | 185 - 200 | 180 - 195 | 185 - 200 | 180 - 195 | |
| Island Gold | 145 - 160 | 145 - 160 | 170 - 185 | 175 - 190 | 220 - 235 |
| 160 - 170 | 140 - 150 | 120 - 130 | 110 - 120 | 120 - 130 | |
| Total Gold Production (000 oz) | 485 - 525 | 470 - 510 | 470 - 510 | 470 - 510 | 520 - 560 |
| Total Cash Costs(1) ($/oz) | |||||
| All-in Sustaining Costs(1),(2) ($/oz) | |||||
| Sustaining capital(1),(3) ($ millions) | |||||
| Growth capital(1),(3) ($ millions) | |||||
| Total sustaining & growth capital(1),(3) (Operating mines; ex. Exploration) ($ millions) | |||||
(1) Refer to the “Non-GAAP Measures and Additional GAAP” disclosure at the end of this press release for a description of these measures.
(2) All-in sustaining cost guidance for 2025 and 2026 includes the same assumptions for G&A and stock based compensation as included in 2024.
(3) Sustaining and growth capital guidance is for producing mines and excludes capital for
Consistent with previous guidance, gold production is expected to decrease slightly in 2025 reflecting the end of residual leaching at the main Mulatos leach pad, partly offset by further low-cost growth from Island Gold. The completion of the Phase 3+ Expansion at Island Gold is expected to drive production approximately 10% higher into 2026, from 2025.
Production guidance for 2026 excludes any production from the higher-grade PDA project which represents an excellent opportunity for additional production within the
Total cash costs and AISC in 2025 are expected to decrease 12% and 4%, respectively, from 2024. This is expected to be driven by low-cost growth from Island Gold, and the end of higher-cost residual leaching at Mulatos. A further increase in low-cost production at Island Gold is expected to drive costs lower into 2026, representing a 15% decrease in total cash costs, and 11% decrease in AISC, relative to 2024.
Capital spending at existing operations (excluding PDA and
(1) Production and AISC are based on mid-point of guidance.
(2) Refer to the “Non-GAAP Measures and Additional GAAP” disclosure at the end of this press release for a description of these measures.
(3) Total consolidated all-in sustaining costs include corporate and administrative and share based compensation expenses.
| Guidance | |||||||
| Q3 YTD 2023 | Q4 2023 | 2023A | 2023E (3) | 2024E | 2025E | 2026E | |
| Gold Production (000 oz) | 135 | 50 | 185 | 185 - 200 | 180 - 195 | 180 - 195 | 180 - 195 |
| Previous Guidance (000 oz) | 185 - 200 | 185 - 200 | |||||
| Total Cash Costs(1) ($/oz) | - | - | |||||
| Mine-site AISC(1),(2) ($/oz) | - | - | |||||
| Tonnes of ore processed (tpd) | 7,888 | 7,877 | 7,885 | 8,000 | 8,000 | ||
| Grade processed (g/t Au) | 2.14 | 2.38 | 2.20 | 2.15 - 2.35 | 2.15 - 2.30 | ||
| Average recovery rate (%) | 90% | 91% | 91% | 90 - 92% | 90 - 92% | ||
| Sustaining capital(1) ($ millions) | - | - | |||||
| Growth capital(1) ($ millions) | - | - | |||||
| Total sustaining & growth capital(1) (ex. exploration) ($ millions) | - | - | |||||
| Capitalized exploration(1) ($ millions) | - | - | $5 | $10 | |||
(1) Refer to the "Non-GAAP Measures and Additional GAAP" disclosure at the end of this press release and the Q3 2023 MD&A for a description and calculation of these measures.
(2) For the purposes of calculating mine-site all-in sustaining costs at individual mine sites, the Company does not include an allocation of corporate and administrative and share based compensation expenses to the mine sites.
(3) Refers to 2023 guidance announced on
Gold production at
Grades mined and processed are expected to range between 2.15 and 2.30 grams per tonne of gold (“g/t Au”) in 2024 and remain at similar levels through 2026. Grades mined are expected to increase in 2027 and beyond and average closer to Mineral Reserve grade, as YD West becomes more of a significant contributor to production.
Total cash costs are expected to increase approximately 5% from 2023 guidance reflecting ongoing cost inflation with the largest driver being labour inflation in
Capital spending in 2024 (excluding exploration) is expected to range between
Island Gold
| Guidance | |||||||
| Island Gold | Q3 YTD 2023 | Q4 2023 | 2023A | 2023E(3) | 2024E | 2025E | 2026E |
| Gold Production (000 oz) | 100 | 32 | 131 | 120 - 135 | 145 - 160 | 170 - 185 | 220 - 235 |
| Previous Guidance (000 oz) | 145 - 160 | 175 - 190 | |||||
| Total Cash Costs(1) ($/oz) | - | - | |||||
| Mine-site AISC(1),(2) ($/oz) | - | - | |||||
| Tonnes of ore processed (tpd) | 1,182 | 1,265 | 1,203 | 1,200 | 1,200 | ||
| Grade processed (g/t Au) | 9.74 | 8.82 | 9.48 | 8.6 - 10.2 | 9.3 - 13.3 | ||
| Average recovery rate (%) | 97% | 98% | 97% | 96 - 97% | 96 - 97% | ||
| Sustaining capital(1) ($ millions) | - | - | |||||
| Growth capital(1) ($ millions) | - | - | |||||
| Total sustaining & growth capital(1) (ex. Exploration) ($ millions) | - | - | |||||
| Capitalized exploration(1) ($ millions) | - | - | $11 | $13 | |||
(1) Refer to the “Non-GAAP Measures and Additional GAAP” disclosure at the end of this press release and the Q3 2023 MD&A for a description and calculation of these measures.
(2) For the purposes of calculating mine-site all-in sustaining costs at individual mine sites, the Company does not include an allocation of corporate and administrative and share based compensation expenses to the mine sites.
(3) Refers to 2023 guidance announced on
Production guidance for Island Gold in 2024 is consistent with previous guidance and represents a 16% increase from 2023 production, reflecting higher grades. Grades are expected to increase further into 2025 and combined with higher mining and processing rates towards the latter part of the year, this is expected to drive an additional 16% increase in production. Following the completion of the Phase 3+ Expansion in 2026, mining rates are expected to begin ramping up towards 2,400 tpd contributing to a further 28% increase in production. As outlined in the Phase 3+ Study, production rates are expected to increase to average 287,000 ounces per year in 2027 and beyond.
Total cash costs and mine-site AISC are expected to decrease 8% from 2023 reflecting higher grades, partly offset by ongoing cost inflation, particularly labour in
Capital spending at Island Gold (excluding exploration) is expected to be between
| Guidance | |||||||
| Q3 YTD 2023 | Q4 2023 | 2023A | 2023E(3) | 2024E | 2025E | 2026E | |
| Gold Production (000 oz) | 165 | 48 | 213 | 175 - 185 | 160 - 170 | 120 - 130 | 120 - 130 |
| Previous Guidance (000 oz) | 140 - 150 | 110 - 120 | |||||
| Total Cash Costs(1) ($/oz) | - | - | |||||
| Mine-site AISC(1),(2) ($/oz) | - | - | |||||
| Tonnes of ore stacked - La | 10,900 | 10,370 | 10,784 | 10,000 | 10,000 | - | - |
| Grades stacked - La | 1.52 | 1.64 | 1.55 | 1.15 - 1.45 | 0.90 - 1.50 | - | - |
| Recovery ratio (%) | 82% | 70% | 78% | 80 - 85% | 80 - 90% | - | - |
| Tonnes of ore stacked - Mulatos crusher (tpd)(4) | 13,700 | 8,097 | 12,260 | 15,000 - 17,000 | - | ||
| Grades stacked - Mulatos (g/t Au) | 1.17 | 2.19 | 1.34 | 0.8 - 1.0 | - | ||
| Recovery ratio (%) | 32% | 27% | 31% | 50 - 55% | - | ||
| Sustaining capital(1) ($ millions) | - | - | $10 | ||||
| Growth capital(1) ($ millions) | - | - | |||||
| Total sustaining & growth capital(1) (ex. exploration) ($ millions) | - | - | |||||
| Capitalized exploration(1) ($ millions) | - | - | $4 | $9 | |||
(1) Refer to the "Non-GAAP Measures and Additional GAAP" disclosure at the end of this press release and the Q3 2023 MD&A for a description and calculation of these measures.
(2) For the purposes of calculating mine-site all-in sustaining costs at individual mine sites, the Company does not include an allocation of corporate and administrative and share based compensation expenses to the mine sites.
(3) Refers to 2023 guidance announced on
Combined gold production from the
La
Total cash costs and mine-site AISC in 2024 are expected to be similar to 2023, though higher than what was incorporated into previous guidance reflecting the increase in production expected from residual leaching. The ounces recovered through residual leaching are expected to carry a reported mine-site AISC of approximately
Production guidance for 2025 was also increased to between 120,000 and 130,000 ounces reflecting slightly higher grades from La
Production is expected to remain at similar levels in 2026 with guidance based on La
Capital spending is expected to total
2024 Global Operating and Development Capital Budget
| 2024 Guidance | 2023 Guidance | |||
| Sustaining Capital(1) | Growth Capital(1) | Total | Total | |
| Operating Mines ($ millions) | ||||
| Island Gold | ||||
| Total – Operating Mines | ||||
| Development Projects ($ millions) | ||||
| - | $25 | $12 | ||
| Total – Development Projects | - | $25 | $25 | $12 |
| Capitalized Exploration(1) ($ millions) | ||||
| - | $10 | $5 | ||
| Island Gold | - | $13 | $11 | |
| - | $9 | $4 | ||
| - | $9 | $5 | ||
| Total – Capitalized Exploration(1) | - | $41 | $41 | $25 |
| Total Consolidated Budget ($ millions) | ||||
(1) Refer to the "Non-GAAP Measures and Additional GAAP" disclosure at the end of this press release for a description and calculation of these measures.
2024 Capital Budget for
Capital spending on the
The majority of the
2024 Exploration Budget
The global exploration budget for 2024 is
Island Gold
A total of
The 2024 exploration program will follow up on a successful 2023 program with high-grade gold mineralization extended laterally to the West and East as well as within multiple structures within the hanging wall and footwall (see press release dated
Consistent with the 2023 program, the majority of the 2024 mine exploration program will be comprised of underground drilling with 41,000 metres ("m") planned. The focus will be the definition of new Mineral Reserves and Resources in proximity to existing production horizons and infrastructure, as well as the conversion of the large existing Mineral Resource base to Reserves. This includes drilling across the strike extent of main Island Gold Deposit (E1E and C-Zones), as well as within a growing number of newly defined hanging-wall and footwall zones. These potential high-grade Mineral Reserve and Resource additions would be low cost to develop and could be incorporated into the mine plan and mined within the next several years providing increased operational flexibility, and further increasing the value of the operation.
Additionally, 12,500 m of surface exploration drilling has been budgeted targeting 1) high potential areas within the Island West, Main and East ore shoots, 2) the up-plunge extension of the Island West ore shoot, and 3) evaluating the potential for high-grade mineralized hanging wall structures near surface.
To support the underground exploration drilling program, 460 m of underground exploration drift development is planned to extend drill platforms on the 850, 945, and 1025-levels. In addition to the exploration budget, 32,000 m of underground delineation drilling has been planned and included in sustaining capital for Island Gold which will be focused on the conversion of the large Mineral Resource base to Mineral Reserves.
The regional exploration program has also been expanded to 10,000 m, up from 7,500 m in 2023. The 2024 program will follow up on high-grade mineralization intersected at the Pine-Breccia and 88-60 targets, located 4 kilometres (“km”) and 7 km, respectively, from the Island Gold mine. Drilling will also be completed in proximity to the past-producing Cline and Edwards mines, as well as at the Island Gold North Shear target. A comprehensive data compilation project will also commence across the broader 40,000 hectare
A total of
Given the ongoing growth of the PDA deposit, other higher-grade sulphide opportunities will be targeted within the
Within the regional exploration program, 26,000 m has been budgeted. Nearly half will be focused on the Capulin target located 4 km from the Mulatos pit where significant, wide intervals of oxide and sulphide gold mineralization were intersected in 2023. This included the previously reported 2.01 g/t Au over 82.45 m core length (23REF012), and 2.73 g/t Au over 120.85 m core length, including 9.31 g/t Au over 29.05 m (23REF022). The remainder of the regional program will be focused on drilling at other high priority targets, including
A total of
The majority of the underground exploration drilling program will be focused on extending mineralization within the
The regional program has been expanded with 7,000 m of surface drilling planned in 2024, up from 5,000 m in 2023. The focus will be on testing multiple near-surface targets across the 5,900 hectare Young-Davidson Property that could potentially provide supplemental mill feed.
Additionally,
A total of
Burnt Timber and Linkwood contain Inferred Mineral Resources totaling 1.6 million ounces grading 1.1 g/t Au (44 million tonnes) as of
Burnt Timber and Linkwood are accessible by an all-season gravel road from
The Company will also continue evaluating and advancing a pipeline of prospective exploration targets within the 58,000-hectare Lynn Lake Property in 2024.
Assumptions and Sensitivities
| Assumptions & Expenses | 2024 | |
| Gold price | $/oz | |
| Canadian dollar | USD/CAD | |
| Mexican peso | MXN/USD | 17.0:1 |
| Amortization | $/oz | |
| General & Administrative(1) | $ millions |
(1) Excludes stock-based compensation.
The 2024 to 2026 production forecast, operating cost and capital estimates are based on a gold price assumption of
Amortization expense in 2024 is expected to total approximately
| Sensitivities | 2024 | Operating Sites Local Currency Exposure | Change | Free Cash Flow Sensitivity (1) |
| Gold price | - | |||
| USD/CAD | 95% | |||
| MXN/USD | 17.0:1 | 40% | 1.00 |
(1) Free cash flow sensitivities include the impact of foreign exchange and short-term gold hedging arrangements noted below.
Current foreign exchange and gold hedging commitments
The Company has entered into the following foreign exchange and short-term hedging arrangements to date:
- Canadian dollar: approximately 55% of Canadian dollar-denominated operating and capital costs for 2024 have been hedged, ensuring a maximum USD/CAD foreign exchange rate of
$0 .75:1 and allowing the Company to participate in weakness in the USD/CAD down to an average rate of$0 .70:1 (if the USD/CAD rate weakens beyond$0 .70:1, the average rate increases to$0 .72:1). - Mexican peso: approximately 17% of Mexican peso-denominated operating and capital costs in 2024 have been hedged, ensuring a minimum MXN/USD foreign exchange rate of 18.0:1 and allowing the Company to participate in weakness in the MXN/USD up to an average rate of 19.8:1.
- Gold collar contracts: The Company also periodically enters into short term gold hedging arrangements. Currently, the Company has hedged 69,750 ounces in 2024, ensuring an average minimum gold price of
$1,926 per ounce and participation up to an average gold price of$2,356 per ounce. This represents approximately 14% of 2024 production (based on mid-point of guidance).
Qualified Persons
About Alamos
Alamos is a Canadian-based intermediate gold producer with diversified production from three operating mines in
FOR FURTHER INFORMATION, PLEASE CONTACT:
Senior Vice President, Investor Relations
(416) 368-9932 x 5439
All amounts are in
The TSX and NYSE have not reviewed and do not accept responsibility for the adequacy or accuracy of this release.
Cautionary Note
This press release contains or incorporates by reference “forward-looking statements” and “forward-looking information” as defined under applicable Canadian and
Forward-looking statements in this press release include, but may not be limited to, information as to strategy, plans, expectations or future financial or operating performance, such as expectations and guidance regarding: costs (including cash costs, AISC, capital expenditures, exploration spending), cost structure and anticipated declining cost profile; budgets; growth capital; sustaining capital; cash flow; foreign exchange rates; gold and other metal price assumptions; anticipated gold production, production rates, timing of production, production potential and growth; returns to stakeholders; the mine plan for and expected results from the Phase 3+ expansion at Island Gold and timing of its progress and completion; feasibility of, development of, and mine plan for, the
The Company cautions that forward-looking statements are necessarily based upon several factors and assumptions that, while considered reasonable by management at the time of making such statements, are inherently subject to significant business, economic, technical, legal, political and competitive uncertainties and contingencies. Known and unknown factors could cause actual results to differ materially from those projected in the forward-looking statements, and undue reliance should not be placed on such statements and information.
Such factors and assumptions underlying the forward-looking statements in this press release, include (without limitation): changes to current estimates of Mineral Reserves and Resources; changes to production estimates (which assume accuracy of projected ore grade, mining rates, recovery timing and recovery rate estimates and may be impacted by unscheduled maintenance, weather issues, labour and contractor availability and other operating or technical difficulties); operations may be exposed to new diseases, epidemics and pandemics, including any ongoing or future effects of COVID-19 (and any related ongoing or future regulatory or government responses) and its impact on the broader market and the trading price of the Company’s shares; provincial, state and federal orders or mandates (including with respect to mining operations generally or auxiliary businesses or services required for the Company’s operations) in
For a more detailed discussion of such risks and other factors that may affect the Company's ability to achieve the expectations set forth in the forward-looking statements contained in this press release, see the Company’s latest 40-F/Annual Information Form and Management’s Discussion and Analysis, each under the heading “Risk Factors” available on the SEDAR+ website at www.sedarplus.ca or on EDGAR at www.sec.gov. The foregoing should be reviewed in conjunction with the information and risk factors and assumptions found in this press release.
The Company disclaims any intention or obligation to update or revise any forward-looking statements whether as a result of new information, future events or otherwise, except as required by applicable law.
Cautionary Note to U.S. Investors
All resource and reserve estimates included in this press release or documents referenced in this press release have been prepared in accordance with Canadian National Instrument 43-101 - Standards of Disclosure for Mineral Projects ("NI 43-101") and the
Investors are cautioned that while the above terms are “substantially similar” to CIM Definitions, there are differences in the definitions under Regulation S-K 1300 and the CIM Standards. Accordingly, there is no assurance any mineral reserves or mineral resources that the Company may report as “proven mineral reserves”, “probable mineral reserves”, “measured mineral resources”, “indicated mineral resources” and “inferred mineral resources” under NI 43-101 would be the same had the Company prepared the mineral reserve or mineral resource estimates under the standards adopted under Regulation S-K 1300. U.S. investors are also cautioned that while the
Cautionary non-GAAP Measures and Additional GAAP Measures
Note that for purposes of this section, GAAP refers to IFRS. The Company believes that investors use certain non-GAAP and additional GAAP measures as indicators to assess gold mining companies. They are intended to provide additional information and should not be considered in isolation or as a substitute for measures of performance prepared with GAAP.
“Cash flow from operating activities before changes in non-cash working capital” is a non-GAAP performance measure that could provide an indication of the Company’s ability to generate cash flows from operations and is calculated by adding back the change in non-cash working capital to “cash provided by (used in) operating activities” as presented on the Company’s consolidated statements of cash flows. “Cash flow per share” is calculated by dividing “cash flow from operations before changes in working capital” by the weighted average number of shares outstanding for the period. “Free cash flow” is a non-GAAP performance measure that is calculated as cash flows from operations net of cash flows invested in mineral property, plant and equipment and exploration and evaluation assets as presented on the Company’s consolidated statements of cash flows and that would provide an indication of the Company’s ability to generate cash flows from its mineral projects. “Mine site free cash flow” is a non-GAAP measure which includes cash flow from operating activities at, less capital expenditures at each mine site. “Return on equity” is defined as earnings from continuing operations divided by the average total equity for the current and previous year. “Mining cost per tonne of ore” and “cost per tonne of ore” are non-GAAP performance measures that could provide an indication of the mining and processing efficiency and effectiveness of the mine. These measures are calculated by dividing the relevant mining and processing costs and total costs by the tonnes of ore processed in the period. “Cost per tonne of ore” is usually affected by operating efficiencies and waste-to-ore ratios in the period. “Sustaining capital” are expenditures that do not increase annual gold ounce production at a mine site and excludes all expenditures at the Company’s development projects. “Growth capital” are expenditures primarily incurred at development projects and costs related to major projects at existing operations, where these projects will materially benefit the mine site. “Capitalized exploration” are expenditures that meet the IFRS definition for capitalization, and are incurred to further expand the known Mineral Reserve and Resource at existing operations or development projects. “Total capital expenditures per ounce produced” is a non-GAAP term used to assess the level of capital intensity of a project and is calculated by taking the total growth and sustaining capital of a project divided by ounces produced life of mine. “Total cash costs per ounce”, “all-in sustaining costs per ounce”, “mine-site all-in sustaining costs”, and “all-in costs per ounce” as used in this analysis are non-GAAP terms typically used by gold mining companies to assess the level of gross margin available to the Company by subtracting these costs from the unit price realized during the period. These non-GAAP terms are also used to assess the ability of a mining company to generate cash flow from operations. There may be some variation in the method of computation of these metrics as determined by the Company compared with other mining companies. In this context, “total cash costs” reflects mining and processing costs allocated from in-process and doré inventory and associated royalties with ounces of gold sold in the period. Total cash costs per ounce are exclusive of exploration costs. “All-in sustaining costs per ounce” include total cash costs, exploration, corporate and administrative, share based compensation and sustaining capital costs. “Mine-site all-in sustaining costs” include total cash costs, exploration, and sustaining capital costs for the mine-site, but exclude an allocation of corporate and administrative and share based compensation. “Adjusted net earnings” and “adjusted earnings per share” are non-GAAP financial measures with no standard meaning under IFRS. “Adjusted net earnings” excludes the following from net earnings: foreign exchange gain (loss), items included in other loss, certain non-reoccurring items and foreign exchange gain (loss) recorded in deferred tax expense. “Adjusted earnings per share” is calculated by dividing “adjusted net earnings” by the weighted average number of shares outstanding for the period.
Additional GAAP measures that are presented on the face of the Company’s consolidated statements of comprehensive income and are not meant to be a substitute for other subtotals or totals presented in accordance with IFRS, but rather should be evaluated in conjunction with such IFRS measures. This includes “Earnings from operations”, which is intended to provide an indication of the Company’s operating performance, and represents the amount of earnings before net finance income/expense, foreign exchange gain/loss, other income/loss, and income tax expense. Non-GAAP and additional GAAP measures do not have a standardized meaning prescribed under IFRS and therefore may not be comparable to similar measures presented by other companies. A reconciliation of historical non-GAAP and additional GAAP measures are available in the Company’s latest Management’s Discussion and Analysis available online on the SEDAR+ website at www.sedarplus.ca or on EDGAR at www.sec.gov and at www.alamosgold.com.
Photos accompanying this announcement are available at:
https://www.globenewswire.com/NewsRoom/AttachmentNg/092ee4fd-6450-43b1-b5ff-d934c3476534
https://www.globenewswire.com/NewsRoom/AttachmentNg/233df61b-d294-4959-977d-a3760292352c

![]()
Figure 1 _ 2024 AISC Guidance
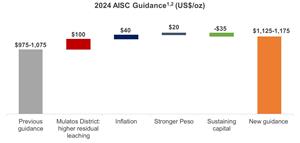
Figure 1 _ 2024 AISC Guidance
Figure 2 _ 2024 - 2026 Production and AISC Guidance
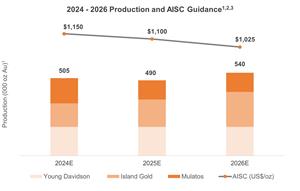
Figure 2 _ 2024 - 2026 Production and AISC Guidance
2024 GlobeNewswire, Inc., source

