In recent Commentaries we have drawn readers’ attention to the extreme equity valuations in the U.S. (Shiller P/E now the second highest on record, passing the peak of Black Tuesday in 1929) and the exaggerated use of leverage employed by traders to profit from this rally (Margin Debt-to-GDP above 2000 and 2007 highs, see chart in our July 14 Commentary, «U.S. Equities To Wimper Higher »). While a low interest rate environment can (and is) driving risk asset prices further than most anyone expected, at some point interest rates can’t be the only driver of risk assets. If global risks are perceived to be mitigated by market participants, then stock prices (regardless of the interest rate) need to reflect the new appreciation of risk. It becomes a tautology to speak of stocks as “risk assets”, with annualized expected returns 5 to 10 times that of a T-Note, if the empirical risk of holding stocks is not many times more significant than holding a T-Note.
Before delving into this week’s subject, we share a couple more indicators reinforcing our belief that markets are in a very late stage of this cycle.
Our first observation is the rapid decorrelation among risk assets over the past year. The breakdown of longstanding relationships between stocks, bonds and commodities are indicated of the enormous miss-pricing of risk taking place today. The chart below compiled by Morgan Stanley shows the global cross-asset correlation coefficient among risk assets.

Equities have become less correlated with currencies, currencies has become less correlated with rates, and everything has become less sensitive to oil. Why? Simply because investors, traders, and especially the machines are misestimating risk. Just like in the run-up to the 2007 crisis, investors are pricing assets based on micro risks (specific to the individual security) and essentially ignoring macro risks. These include macroeconomic data points (see Friday’s slump in U.S. durable goods orders or the July plunge in new home sales), the possibility (or high probability) of a central bank policy errour in-the-making, or geopolitical risks (North Korea or the real possibility that none of Trump’s highly-touted economic programme will pass Congress). As market participants seek excuses to stay bullish, these traditional cross-asset correlations will continue to break-down…and historically these cross-asset correlations tend to break-down in a late-cycle environment.
A second indicator we will share this week concerns the U.S. gross value added (GVA) of non-financial businesses. GVA is a productivity metric that measures the contribution to an economy (in this case) of nonbank U.S. firms. GVA provides a dollar value for the amount of goods and services that have been produced, less the cost of all inputs and raw materials that are directly attributable to that production. In sum, GVA is an excellent measure of the health of an economy.
We take the BEA’s quarterly measure of gross value added and put the index in real, inflation-adjusted terms using the annual change in the CPI. The chart below shows the year-on-year change in the real GVA. The change in GVA has turned negative, the first drop into negative territory since September 2007. This is not the sign of a robust, growing U.S. economy. Some might argue that the stocks are anticipating better economic times ahead. But at this point, the stock market would seem to be very much ahead of itself, as economic value-added and the S&P 500 have been heading in polar opposite directions for a few quarters now.

Getting back to our crystal ball…while U.S. equities, despite their reliance, seem to be a very unattractive alternative for investors today, we remain constructive on foreign equities (despite the possibility of a shortterm shake-out, concomitant with a normalization of U.S. benchmark equity valuations).
While markets always move in cycles, different asset classes obviously do not perform the same as one another in any particular cycle. We recall, as market historians, that in every major market cycle in the past 30 years, one asset class has been head-and-shoulders above the rest. This “favourite asset” gathered the lion’s share of financial media headlines over the cycle and eventually drew in money from all investors, forming (in retrospect) a bubble in this asset. Our working hypothesis is the following:
“The asset class being the source/cause of a financial “mania” in the current cycle will fall relatively more than other asset classes at the end of the cycle AND become a notable laggard in the subsequent cycle”.
Consider the following examples we have witnessed over the years.
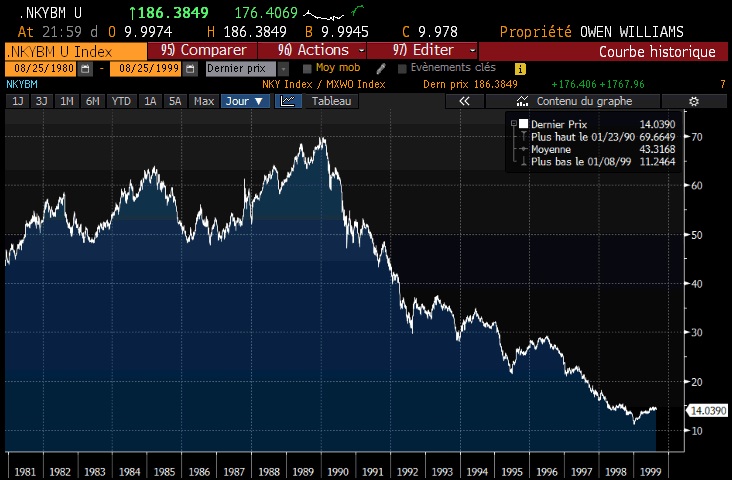
Japan Inc, 1982-1990
Japan Inc. is the nickname for the corporate world of Japan that came about during the 1980s boom, when Western business people saw how closely the Japanese government worked with its nation's business sector. Unfortunately, the high degree of collusion between Japan's corporate and political sectors led to corruption throughout the system and contributed to the downfall of the overvalued Nikkei (shown below).

Once the Japan Inc bubble burst, no one wanted any part of Japanese equities…for a long time. The next chart shows the Nikkei relative to the MSCI World Index. The 1990s were a great time for equities, provided that you were not in Japan.
Technology Bubble, 1992-2000
During the formation of a tech bubble, investors begin to collectively think that there's a huge opportunity to be had, or that it's a "special time" in the markets. This leads them to purchase stocks at prices that normally wouldn't even be considered. New metrics were used to justify these stock prices (eyeballs per click, etc), but fundamentals as a whole took a backseat to rosy forecasts and blind speculation. The next chart shows the Nasdaq Composite.

Of course we all remember the tech meltdown (almost -80%) and our objective is neither to scare investors nor suggest that equities are on the brink to repeat the tech bubble collapse. Rather we want to highlight that in the 2003-2007 bull market, tech stocks were relative losers. The next chart shows the Nasdaq relative to the MSCI All World.

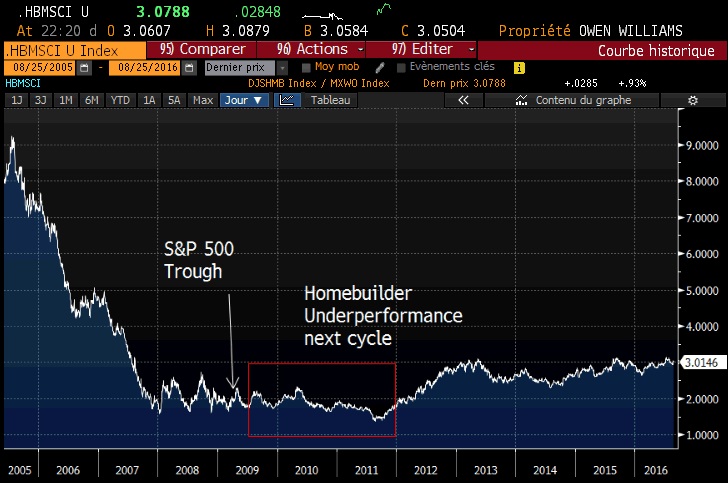
Housing Bubble, 2002-2006
After the Tech Bubble and 2000-2003 recession, Fed Chair Allen Greenspan left rates low for too long, spawning an interest rate environment propitious for home equity loans. On top of that, the government and U.S. politicians wanted to increase homeownership (and happy voters for reelection) and facilitated mortgages for all hopeful homebuyers through Freddie Mac and Fannie Mae. Both the home prices indexes soared with demand for homes while the homebuilder stocks (Dow Jones Homebuilder Index shown below) led equity gains from 2003-2005.

Same song, different refrain. From the 2005 peak in Home Builders, the subsequent bull market did not shine on this sector. The next chart shows the Dow Jones Homebuilder Index relative to the MSCI All World.
China Stock Bubble of 2007
Initially fueled by speculation and an overheating housing market, the Chinese equity market collapsed after rumors that governmental economic authorities were going to raise interest rates in an attempt to curb inflation and that they planned to clamp down on speculative trading with borrowed money. Next is the CSI 300 China Mainland Index.

While global equities bottomed in March 2009, Chinese equities became massive underperformance as the subsequent bull market got underway. Below is the CSI 300 relative to the MSCI All World.

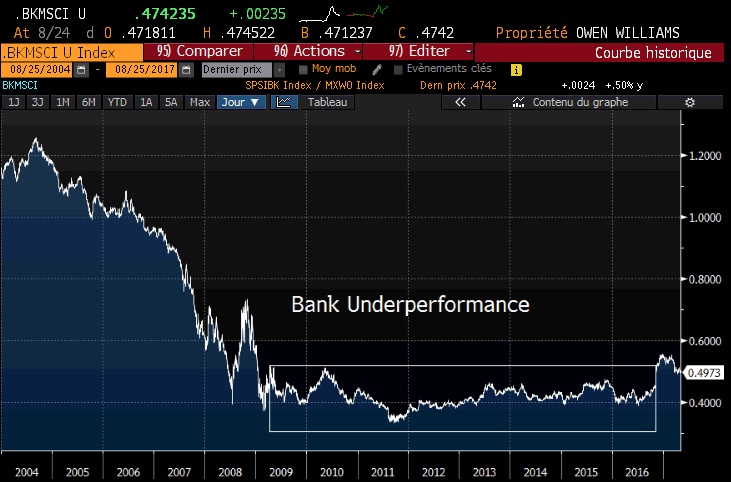
Financial Crisis
Our last example is the Financial Crisis of 2008-09. Banks were at the center of subprime and logically bank stocks suffered the most in the bear market. As stated above, the source/cause of a financial market mania proves to be the loser in the subsequent bull market. This has rung very true for bank stocks. Below is the S&P Bank Index relative to the MSCI All World.
The Fed Bubble
We won’t rehash here the fundamental arguments that support our belief that U.S. equities are in a bubble. Many will continue to invest or trade in U.S. stocks as it is nearly impossible for most managers to neglect 50% of world stock market capitalization…especially when this asset class is a steady outperformer among world equities. What makes today so unique is that asset concerned by this bubble (all U.S. stocks) is hardly a remote niche within the equity space! And as almost every investor is concerned by the run-up in U.S. stocks, each of us must choose to look like a fool either before U.S. equities peak or after U.S. equities peak.
Make no mistake, we firmly believe that U.S. equities as a whole (and particularly those stocks in vogue with passive index investors) will be the relative losers within the equity space once the market finally tops out, AS WELL AS for several years over the subsequent bull market. Of course there will be relative winners among U.S. stocks going forward which managers skilled in stock picking may capture. Our point here is that U.S. indexes will no longer be ‟the place to be″.
As investors, you must ask yourself today some serious “what if” questions should U.S. markets turn down sharply. First, is your investment horizon sufficiently long to allow time to recover losses? While not our base case scenario, we remind investors that the S&P Technology index took 17-years to recover losses from the 2000 bubble peak. Second, if “trapped” in an equity position, what stocks would you be willing to hold in a prolonged downturn? We recommend companies with solid balance sheets, positive cash flow / low debt, strong business models, and high dividend yields (with consistent profitability in order to maintain dividends payments).
Conclusion
We don’t have a crystal ball which can predict when the U.S. equity market will return from the stratosphere. However what we can predict is that the future equity market outperformance will come from high growth emerging markets whose company valuations relative to U.S. big cap names are more than compelling today. As shown above, history repeatedly demonstrates that asset class “winners” in one cycle are the relative losers in the next cycle. We know where we don’t want our portfolios allocated come the Day of Reckoning on financial markets.


