Project Highlights (all amounts are in CA$, unless otherwise stated):
- Gross metal revenue of the minerals produced from the operation total
$15.2 billion over the life of the operation. - Gross earnings after-tax is
$6.25 billion . - The Project has a pre-tax net present value (NPV) of
$2.97 billion and an after-tax NPV of$1.72 billion (10% discount rate). - Pre-tax internal rate of return (IRR) is 42.9% and an after-tax IRR of 32.8%.
- Annual Net revenues average
$608.0 million from the sale of high-purity scandium oxide (Sc2O3), scandium-aluminum Master alloy (ScAl) and rare earth element (REE) hydroxide concentrate. - The pre-tax capital payback is 2.5 years from the start of production.
- Total mined metal production over a minimum 25-year mining life based on the present resource base is expected to be 110 t Sc2O3, 57,298 t of ScAl Master alloy and 23,578 t of REE hydroxide concentrate.
- The prices and market segments were based on estimates from comprehensive market studies by
Ernst Young for scandium and by Roskill Information Services for rare earths.
Table 1 – Pre- and After-Tax Net Present Value (NPV) –
| Discount Rate | Pre-Tax Net Present Value (NPV) Million CA$ | After-Tax Net Present Value (NPV) Million CA$ | ||
| @ 5% @ 7% @ 10% @ 11% @ 12% @ 15% | ||||
| Internal Rate of Return (IRR) | 42.9% | 32.8% | ||
| Payback from Production Startup | 2.5 years | 3.0 years | ||
The salient metrics related to the PEA study of the TG North Lobe and the projected mining and processing costs to produce Sc2O3, ScAl Master alloy and REE hydroxide concentrate are outlined in Table 2.
Table 2 – Project Metrics, Crater Lake TG North Lobe Deposit
| Project Metric | Units | Value |
| Pre-tax NPV @ 10% | $M | 2,971 |
| After-tax NPV @ 10% | $M | 1,721 |
| Pre-tax IRR | % (real) | 42.9 |
| After-tax IRR | % (real) | 32.8 |
| Pre-tax Payback Period from start of production | Years | 2.5 |
| Initial Direct Capital Expenditure (“CAPEX”) | $M | 602.9 |
| Initial Indirect Capital Costs | $M | 108.8 |
| Initial Project Contingency (25%) | $M | 159.2 |
| Total Initial CAPEX (Direct + Indirect + Contingency) | $M | 870.9 |
| Maximum Open-Pit Production Rate | tpa | 423,118 |
| Maximum Concentrate Production Rate | tpa | 217,059 |
| Years | 25 | |
| Ramp-up to Full Production | Years | 2 |
| Total Revenues | $M | 15,200 |
| Average Annual Net Revenues | $M | 608 |
| Total Operating Costs | $M | 3,727 |
| Pre-tax Operating Cash Flow | $M | 10,309 |
| After-tax Operating Cash Flow | $M | 6,259 |
| Operating Margin | % | 63.8 |
| Life-of-Mine Operating Cost Estimates | Units | Value |
| $/t mill feed | 233 | |
| Hydrometallurgical Facility - Sc2O3 | $/t mill feed | 12 |
| Master Alloy Facility - ScAl | $/t mill feed | 108 |
| Selling, General & Administration (G&A) Costs | $/t mill feed | 8 |
| Royalties (single payment buyout) | $/t mill feed | 0.20 |
| Sustaining Capital Costs + Restoration | $/t mill feed | 20 |
| Total Operating Costs | $/t mill feed | 381 |
Table 3 – Commodity Price Assumptions Used in the Financial Model
| Metal Oxides / Alloy | US$/kg | Note | |
| Scandium Oxide (Sc2O3) | $ | 1,500.00 | |
| Al-2% Sc Master Alloy | $ | 204.00 | |
| Dysprosium Oxide (Dy2O3) 2 | $ | 128.40 | |
| Lanthanum Oxide (La2O3) 2 | $ | 1.50 | |
| Neodymium Oxide (Nd2O3) 2 | $ | 49.20 | |
| Praseodymium Oxide (Pr2O3) 2 | $ | 49.20 | |
| Terbium Oxide (Tb4O7) 2 | $ | 584.40 | |
Table 3 NOTES:
1 – Source:
2 - Only magnet
“The WSP study results confirm that the TG-Zone deposit has robust economics with the potential to be a long-term provider of critical Scandium and magnet Rare Earths to world markets,” stated
WSP Canada General Project Description
The WSP study utilizes an open-pit mining operation model and a scandium price deemed conservative, below the 2021
WSP applied a conventional Truck and Shovel open-pit mining operation model to the TG North Lobe Deposit at a production rate of 2,350 tonnes per day during a six-month per year operation period (Table 2, Figure 2), using the
The mine operation infrastructure, storage and tailings facilities would be developed at
Imperial expects to receive a copy of the final 43-101 PEA report from WSP within 45 days from the date of this press release. The final PEA report, which is being prepared according to National Instrument 43-101 Guidelines, will be filed on SEDAR and available under Imperial’s company profile at SEDAR.com (Imperial Mining Group Ltd SEDAR Profile).
Project Optimization Opportunities
These PEA results have demonstrated the economic viability of the project and the project’s capability in achieving high Sc and REE recoveries. However, there are still several process improvement opportunities and infrastructure development options that will benefit the project.
Future project optimization programs and trade-off studies that are expected to yield further reduction in CAPEX and/or OPEX include:
- Completion of the ongoing SGS hydrometallurgical program. The objective of this work is to improve the scandium recovery, lower mine operating costs and reduce carbon footprint of Imperial’s metallurgical process.
- Further investigation of sensor ore sorting as a pre-concentration step in mineral processing to reduce ore milling cost.
- Development of the Al-2%Sc Master Alloy technology.
- Economic trade-off study focused on mineral concentrate transportation from the mine site to the processing plant at
Sept Iles evaluating simplification of the design of concentrate storage, loading and unloading using silos. - Converting winter road access to the property from the existing road infrastructure to a permanent road to be financed from the operation revenues.
- Source electrical power from renewable sources at the Mine site (wind, solar, in-river hydro power) to reduce energy costs and carbon emissions.
Crater Lake TG North Lobe Scandium-Rare Earth Resource Model
The PEA study was based on a Mineral Resource Estimate undertaken for Imperial by InnovExplo of Val d’Or,
The resources estimation was undertaken using the diamond drillhole data completed over the Northern Lobe of the TG Scandium-Rare-Earth mineralized Zone. Mineralization is related to an iron-rich syenitic intrusive (Ferrosyenite) sill and dyke system and was drilled over a strike length of 300 m, to a vertical depth of 200 m. Intersection lengths through the zone varied between 10.7 m and 111.9 m, representing a true thickness of up to 100 m. There was an observed general increase in resource grade and true thickness to mineralization at depth below the pit-shell and towards the north. The definition drilling was completed over the northern half (Northern Lobe) of the magnetic target that defines the
Table 4 – Crater Lake TG North Lobe Mineral Resource Estimate
| Category | Cut-off NSR ($/t) | Tonnage (Mt) | NSR total ($/t) | Sc2O3 (g/t) | Dy2O3 (g/t) | La2O3 (g/t) | Nd2O3 (g/t) | Pr2O3 (g/t) | Tb4O7 (g/t) |
| Indicated | 110.8 | 7.3 | 413 | 282 | 66 | 606 | 596 | 160 | 12 |
| Inferred | 110.8 | 13.2 | 386 | 264 | 62 | 569 | 573 | 154 | 11 |
Mineral Resource Estimate Notes:
1. The independent and qualified persons for the mineral resource estimate, as defined by NI 43 101, are
2. These mineral resources are not mineral reserves, as they do not have demonstrated economic viability. Mineral Resources are classified in accordance with the CIM (2014) Standards and Definitions of Mineral Resources.
3. The results are presented in-situ and undiluted and considered to have reasonable prospects of economic viability.
4. The estimate encompasses three mineralized zones using the grade of the adjacent material when assayed or a value of zero when not assayed.
5. High-grade capping supported by statistical analysis was done on raw assay data before compositing and established for La2O3 (3690 g/t), Pr2O3 (1380 g/t), Nd2O3 (2100 g/t), Dy2O3 (215 g/t). No capping was applied to Sc2O3 and Tb4O7.
6. The resource estimate was completed using GEOVIA Surpac 2021 using a sub-block model at a parent block matrix of 5m x 5m x 5m (minimum block size of 1.25m x 1.25m x1.25m). Grade interpolation was obtained by inverse distance squared using hard boundaries.
7. Bulk density values applied are 3.13 t/m3 and 2.91 t/m3 for the olivine ferrosyenite and pyroxene ferrosyenite, respectively; the principal hosts for the mineral resources.
8. The mineral resource estimate is classified as Indicated and Inferred. The Indicated mineral resource category is defined with a minimum of three (3) drill holes within the areas where the drill spacing is less than 60 m and shows reasonable geological and grade continuity. The Inferred category is defined with a minimum of two (2) drill holes within the areas where the drill spacing is less than 120 m and shows reasonable geological and grade continuity. Clipping boundaries were used for classification based on those criteria.
9. The mineral resource estimate is pit-constrained with a bedrock slope angle of 45° and an overburden slope angle of 30°. It is reported at a Net Smelter Return (NSR) cut-off of CA$110.80/t. The NSR cut-off was calculated using the following parameters: processing cost = CA$14.89/t; transportation cost (concentrate transportation from mine site to processing plant): CA$17.01/t of ore milled; G&A = CA$7.19/t; refining and selling costs = CA$ 88.71/t; Sc2O3 price =
10. The number of metric tonnes was rounded to the nearest thousand, following the recommendations in NI 43-101 and any discrepancies in the totals are due to rounding effects.
11. The authors are not aware of any known environmental, permitting, legal, title-related, taxation, socio-political, or marketing issues, or any other relevant issue not reported in the Technical Report, that could materially affect the Mineral Resource Estimate.
Financial and Sensitivity Analysis
The expected project cash flows were modelled using a simple discounted cashflow model, using discount rates of 5%, 7%, 10%, 11%, 12% and 15%. Imperial is using at 10% discount rate as its base assumption. The project cashflow is scheduled annually and uses an exchange rate of
A simple tax model was constructed using a depletion model for depreciation estimates. No opening balance of tax credits, rebates, tax-free holidays or eligible prior expenditures were used in this analysis. Table 5 summarizes the estimated total Life-of-Mine (LOM) model design criteria.
Sensitivity analysis of the model indicates that the operation would be most sensitive to changes in metal pricing and CAD:USD exchange rate and least sensitive to changes in operating costs (Figure 5). An exchange rate of $1US =
Imperial has developed an innovative process for extraction of scandium (Sc) and rare earth elements (REE) from its
Table 5 – Crater Lake TG North Lobe Sc-REE Deposit Financial Model Design Criteria (all amounts are in CA$, unless otherwise stated)
| CATEGORY | VALUE | UNITS |
| MINING (includes a 5% dilution) Mineralization Mined Waste Mined Overburden TOTAL Mined (Strip Ratio = 2.01) | 10.6 18.9 2.4 31.8 | Mt Mt Mt Mt |
| PROCESSING Run-of- Run-of- | 10.6 426,000 | Mt t |
| MINED MINERAL GRADE (includes a 5% dilution) Sc2O3 Dy2O3 La2O3 Nd2O3 Pr2O3 Tb4O7 | 268.3 62.4 583.0 567.0 152.8 11.1 | g/t g/t g/t g/t g/t g/t |
| MINERAL CONCENTRATES PRODUCED Containing: | 5.4 | Mt |
| Sc2O3 | 2,559,592 | kg |
| Dy2O3 | 429,172 | kg |
| La2O3 | 4,008,593 | kg |
| Nd2O3 | 3,898,455 | kg |
| Pr2O3 | 1,050,318 | kg |
| Tb4O7 | 76,499 | kg |
| PRODUCT SOLD (LOM) | ||
| Sc2O3 (SOFC)* Aluminum + 2% Sc - Master Alloy | 110 57,298 | t t |
| Dy2O3 | 377 | t |
| La2O3 | 3,521 | t |
| Nd2O3 | 3,425 | t |
| Pr2O3 | 923 | t |
| Tb4O7 | 67 | t |
| CATEGORY | VALUE | UNITS |
| METAL OXIDES PRICES | ||
| Sc2O3 | 1,875.00 | $/kg |
| Aluminum + 2% Sc - Master Alloy | 255.00 | $/kg |
| Dy2O3 | 160.50 | $/kg |
| La2O3 | 1.88 | $/kg |
| Nd2O3 | 61.50 | $/kg |
| Pr2O3 Tb4O7 | 61.50 730.50 | $/kg $/kg |
| GROSS METAL VALUES (LOM) Sc2O3 (SOFC)* | 205,896,000 | CA$ |
| Aluminum + 2% Sc - Master Alloy | 14,610,979,000 | CA$ |
| Dy2O3 + La2O3 + Nd2O3 + Pr2O3 + Tb4O7 Concentrate | 383,566,000 | CA$ |
| Total | 15,200,441,000 | CA$ |
Table 5 NOTES: * - represents Sc2O3 use in Solid Oxide Fuel Cells (SOFC).
The two-stage hydrometallurgical extraction method entails a high-pressure caustic leach (HPC) followed by hydrochloric acid leach of the HPC residue. The new method showed remarkable recovery of scandium and the rare earth elements from Imperial’s Crater
- The method showed scandium recovery to primary leach solution (PLS) of 84% for the metallurgical sample.
- The recovery of total rare earth element, including yttrium (TREE+Y) of 84% from the metallurgical sample.
- The high recoveries of Sc and TREE+Y from the sample show that the method has excellent efficacy in extracting Sc and REE from samples representing the mineralization observed in drilling.
- The NaOH and the hydrochloric acid used in the leaching process are regenerated and recycled back to the process. Caustic is regenerated using lime, while HCl is recovered with the addition on sulphuric acid.
- The scandium oxide would be converted into an Al-2%Sc master alloy product using co-electrolysis of Al and Sc from alumina and scandia in a process similar to the Hall–Heroult method used for the production of primary aluminum metal.
IPG recently commissioned a hydrometallurgical flowsheet development program based on its patent-pending two-stage hydrometallurgical method for the extraction of scandium and rare earth elements with SGS Canada. The program, which started on
Table 6 represents the Capital and Operating costs for the envisaged mine and processing complex in the PEA study.
Table 6 – Capital and Operating Costs Assumed in the PEA Study (all amounts are in CA$, unless otherwise stated)
| CAPITAL COSTS | (Million $) | $/t of milled mineralization |
| Direct Costs | ||
| Mine Equipment | 13.7 | 1.29 |
| 63.7 | 6.02 | |
| 160.1 | 15.13 | |
| Power & Electrical Both CL and Sept-Iles Sites | 14.1 | 1.33 |
| 113.5 | 10.73 | |
| TSF & Water Management | 69.3 | 6.55 |
| 46.6 | 4.40 | |
| Off Site Concentrate Handling Infrastructure | 27.5 | 2.60 |
| Camp (200 Person Capacity) | 26.5 | 2.50 |
| Studies and Preliminary Engineering | 0.0 | 0.00 |
| Exploration and Geology Activities | 0.0 | 0.00 |
| Pre-Production Mining Licences | 0.2 | 0.02 |
| Pre-Production | 67.9 | 6.42 |
| SubTotal Direct Costs | 602.9 | 57.00 |
| Indirect Costs | 108.8 | 10.28 |
| Contingency (25%) | 159.2 | 15.05 |
| Total Capital Cost (All in + Tax) | 870.9 | 82.33 |
| OPERATING COSTS | (Million $) | $/t of milled mineralization |
| 248.5 | 23.49 | |
| 430.9 | 40.73 | |
| 36.0 | 3.40 | |
| 27.5 | 2.60 | |
| 192.4 | 18.19 | |
| Lodging Crater Lake | 140.1 | 13.25 |
| Transportation + Domes | 1,387.6 | 131.18 |
| Hydromet Facility Sc2O3 | 58.5 | 5.53 |
| Hydromet Facility Al + 2% Sc Master Alloy,Sept-Iles | 1,139.8 | 107.75 |
| Surface Mobile Equipment Sept-Iles | 24.8 | 2.35 |
| Water Management Sept-Iles | 108.6 | 10.27 |
| Capitalized Operating Costs | -679.1 | -6.42 |
| Total Operating Cost | 3,726.8 | 352.32 |
| OPERATING COSTS | (S Millions) | $/t of milled mineralization |
| Selling General & Administrative Costs | 83.6 | 7.90 |
| Royalties | 2.0 | 0.20 |
| Sustaining Capital Costs + Restoration | 207.7 | 19.63 |
| Total Operating Cost (( | 4,020.1 | 380.05 |
| PROJECT ECONOMICS | ||
| Net Revenue | 15,200 | M$ |
| Operating Cost | 4,020 | M$ |
| Capital Costs | 871 | M$ |
| Total | 10,309 | M$ |
| Taxes | 4,050 | M$ |
| Total After-Tax Cash Flow | 6,259 | M$ |
| Pre-Tax Net Present Value @ 10% Discount | 2,971 | M$ |
| Pre-Tax Internal Rate of Return | 42.9 | % |
| Pre-Tax Payback Period | 2.5 | Year |
| After-Tax Net Present Value @ 10% Discount | 1,721 | M$ |
| After-Tax Internal Rate of Return | 32.8 | % |
| After-Tax payback period | 3.0 | Year |
Qualification Statement
The company has not made a production decision for the
QUALIFIED PERSONS
WSP CANADA INC.
The technical and financial data for the PEA study content was prepared and certified by WSP Canada Inc. Qualified Persons:
The technical content in this press release was reviewed and certified by Dr.
STUDY EFFECTIVE DATE
The Study Effective Date is
ABOUT
Imperial is a Canadian mineral exploration and development company focused on the advancement of its technology metals projects in
For further information please contact:
President and Chief Executive Officer Phone: +1 (514) 360-0571 Email: info@imperialmgp.com |
Website: www.imperialmgp.com Twitter: @imperial_mining Facebook:
This press release may contain forward-looking statements relating to the Company’s operations or to its business environment. Such statements are based on the Company’s operations, estimates, forecasts, and projections, but are not guarantees of future performance and involve risks and uncertainties that are difficult to predict or control. Several factors could cause actual outcomes and results to differ materially from those expressed. These factors include those set forth in the corporate filings. Although any such forward-looking statements are based upon what management believes to be reasonable assumptions, the Company cannot guarantee that actual results will be consistent with these forward-looking statements. In addition, the Company disclaims any intention or obligation to update or revise any forward-looking statements, for any reason. We also do not commit in any way to guarantee that we will continue reporting on items or issues that arise. Investors are cautioned that this press release contains quoted historical exploration results. These are derived from filed assessment reports and compiled from governmental databases. The Company and a QP have not independently verified and make no representations as to the accuracy of historical exploration results: these results should not be relied upon. Selected highlight results may not be indicative of average grades.
Neither
Five figures accompanying this announcement are available at:
https://www.globenewswire.com/NewsRoom/AttachmentNg/2d03028c-2f56-48ea-9129-d9ee1eaa332f
https://www.globenewswire.com/NewsRoom/AttachmentNg/80859c9e-7499-4046-95b9-2fde296928f9
https://www.globenewswire.com/NewsRoom/AttachmentNg/e64d0e8e-5818-441e-9098-12b4c4faaefc
https://www.globenewswire.com/NewsRoom/AttachmentNg/62828eda-c372-465f-84e1-4209a748b594
https://www.globenewswire.com/NewsRoom/AttachmentNg/34bc85be-3880-4c3d-970d-c57f064fdf65

![]()
Figure 1

Crater Lake Project Transportation Logistics Tradeoff Plan Map
Figure 2

Conceptual Layout of Open-Pit Operation Infrastructure, Crater Lake, Scandium + REE TG Zone
Figure 3
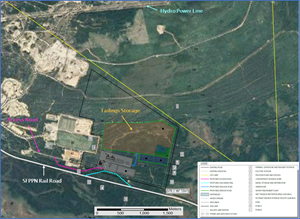
Conceptual Layout of Process Plant and Tailings Site Infrastructure, Sept-Iles, QC
Figure 4

Crater Lake TG North Lobe Deposit Pit -shell and Resource Blocks by Category
Figure 5

Plot of the Crater Lake Project Sensitivity Analysis on its Impact to Net Present Value (NPV)
2022 GlobeNewswire, Inc., source
