The reader is cautioned that any reference to mineral resources or geological technical information about Osino’s mineral properties is based on, excerpted from and expressly qualified by Osino’s current technical report (the “Technical Report”) which was prepared in accordance with NI 43-101 entitled, “Twin Hills Gold Project,
The results of the Company's preliminary economic assessment ("PEA") that are described herein is a preliminary technical and economic study of the potential viability of the
The production target and forecast financial information referred to in this PEA are comprised of both Inferred Mineral Resources and Indicated Mineral Resources. Metallurgical recoveries have been based on test work data and costs have been estimated by independent consultants generally from budget quotations, factored estimates or cost data from similar operations/projects. Cost estimate accuracy for the PEA results described herein are in the order of ±35%. A more specific description of the assumptions, qualifications, and basis for the results of the PEA are described below, and the key assumptions and economic parameters are set out in Table 2.
PEA Highlights
- 15-year Life-of-Mine (“LOM”) and 3.5 million tonnes per annum (“mtpa”) processing capacity.
- LOM gold recovery of 90.9% utilising conventional 3-stage crushing/ball milling and carbon-in-leach processing layout.
- Average annual gold production for years two to six of 124,000 ounces per year at an average operating cost of
US$827 /oz produced. Average LOM gold production of 99,000 ounces per annum. - Pre-production capital cost estimate of
US$176 million plusUS$26m contingency (15%). - Cumulative LOM net cash flow of
US$858 million (pre-tax) andUS$560 million (after-tax). - Net Present Value (“NPV”) of
US$579 million (pre-tax) andUS$377 million (after-tax) at a 5% discount rate with a respective after-tax payback period of 2.3 years and internal rate of return ("IRR") of 38%, using a base gold price ofUS$1,700 /oz. - PEA based on the previously reported Mineral Resource block model from the Technical Report, using a cut-off grade of 0.3 g/t Au, resulting in an Indicated Mineral Resource of 14.0 million tonnes (“Mt”) at 0.98 g/t Au and an Inferred Mineral Resource of 46.2 Mt at 1.02 g/t Au, derived from 69,000m of drilling.
- An additional 31,987 m of infill and expansion drilling has been completed at Twin Hills since the
April 1, 2021 effective date of the Technical Report, but has not been included in the PEA. This will be included in subsequent updates of the Mineral Resource once the drill program has been completed and all corresponding assay results have been received. - Ongoing infill, resource expansion and brownfields exploration drilling with 10 drill rigs, in addition to ongoing project optimization, is likely to result in improved production parameters and economic outcomes to be published as part of the feasibility study which is expected to be completed during H1 of 2022.
The PEA was prepared by
PEA Overview and Financial Analysis
The table below summarizes the results and key valuation metrics of the PEA on a pre- and post-tax basis.
Table 1: Preliminary Economic Assessment Summary
| Units | Pre-Tax | Post-Tax | Pre-Tax | Post-Tax | |||||
| NPV5% | US$m | 579 | 377 | 724 | 467 | ||||
| IRR | % | 45 | % | 38 | % | 53 | % | 44 | % |
| Payback | Years | 2.2 | 2.3 | 1.9 | 2.1 | ||||
| LOM Cashflow | US$m | 858 | 560 | 1260 | 1058 | ||||
The financial model was completed on a 100% project basis and includes a 3% gross royalty and 1% export levy to the Namibian government. The economic analysis carried out for the Project uses a cash flow model at a base gold price of
The financial assessment of the Project was carried out on a 100% equity basis, not accounting for potential sources of funding which may include debt. No provisions were made for the effects of inflation, and Osino’s understanding of current Namibian tax regulations were applied to assess the tax liabilities.
Figures 1 to 4 below summarize the LOM production schedule and key production metrics.
Figure 1 accompanying this announcement is available at https://www.globenewswire.com/NewsRoom/AttachmentNg/a8d85007-2d16-480a-a0e5-eb91e21f19bc
Figure 2 accompanying this announcement is available at https://www.globenewswire.com/NewsRoom/AttachmentNg/a67ead31-e96b-49f2-a9c7-da47c97345d9
Figure 3 accompanying this announcement is available at https://www.globenewswire.com/NewsRoom/AttachmentNg/dd613786-4644-4f68-85a9-9d22031f9093
Figure 4 accompanying this announcement is available at https://www.globenewswire.com/NewsRoom/AttachmentNg/58fc677c-1dac-4e9a-9608-a6c78aa249d0
A summary of the production schedule in tabulated format and cash flow model with key economic results can be viewed in Table 8 below:
It should be noted that there is scope for significant optimization and improvement to the mine design and production schedule which will be reflected together with an updated Mineral Resource in the next technical assessment of the project.
The key operating assumptions and economic parameters used in the PEA are tabulated below:
Table 2: Key Assumptions and Economic Parameters
| Item | Units | Amount | |
| Life of Mine | Years | 15 | |
| Gold price (base case) | US$/oz | 1700 | |
| Mining dilution | % | 5,0 | % |
| Mineralized material loss | % | 3,5 | % |
| Gold Recovery | % | 90,9 | % |
| Royalty | % | 3,0 | % |
| Export Levy | % | 1,0 | % |
| Life-of-Mine Production Parameters | Units | Amount | |
| Mineralized Material Tonnes Mined | ‘000 000 t | 48,7 | |
| Waste Tonnes Mined | ‘000 000 t | 243,2 | |
| Strip Ratio | 5,0 | ||
| Processed Tonnes | ‘000 000 t | 48,7 | |
| Processed Grade | g/t | 0,98 | |
| LOM Gold Production | ‘000 oz | 1 390 | |
| LOM Average Annual Gold Production | ‘000 oz per annum | 99 | |
| Average Annual Gold Production Years 2 – 6 | ‘000 oz per annum | 124 | |
| Unit Costs per Tonne Mined/Processed | Units | Amount | |
| Refining cost (per ounce produced) | US$/oz | 0.55 | |
| Gold transport cost (per ounce produced) | US$/oz | 2.20 | |
| US$/t | 2.25 | ||
| US$/t | 2.05 | ||
| Processing Cost (per tonne processed) | US$/t | 8.97 | |
| G&A Cost (per tonne processed) | US$/t | 3.00 | |
| Unit Costs per Ounce Produced | Units | Amount | |
| LOM Average Operating Costs 1 | US$/oz | 857 | |
| LOM Average Cash Costs 2 | US$/oz | 928 | |
| LOM Average All-in Sustaining Costs 3 | US$/oz | 945 | |
| Capital Costs | Units | Amount | |
| US$m | 176 | ||
| Contingency @ 15% | US$m | 26 | |
| US$m | 202 | ||
| Sustaining Capital | US$m | 39 | |
Notes:
- Mining, processing plus on-site G&A.
- Operating costs plus selling costs, royalties & levies.
- Cash costs plus sustaining capital (excl. closure costs & salvage value).
Sensitivity Analysis
An after-tax sensitivity analysis to the key project variables was carried out which indicates that the project is most sensitive to a change in grade or gold recovery, as indicated by the orange line in the diagram below.
Figure 5 accompanying this announcement is available at https://www.globenewswire.com/NewsRoom/AttachmentNg/0731069f-63b9-4327-ac54-56e3066def85
Table 3: Two-factor Post-Tax Project NPV Sensitivity Analysis
| Grade | Post-Tax NPV5% Sensitivity – Mineralized Material Grade & Gold Price | |||||||||
| g/t | 1400 | 1500 | 1600 | 1700 | 1800 | 1900 | 2000 | |||
| 0,88 | -10,0% | 108 | 163 | 218 | 274 | 328 | 383 | 437 | ||
| 0,93 | -5,0% | 151 | 209 | 267 | 325 | 383 | 440 | 497 | ||
| 0,98 | 0,0% | 194 | 255 | 316 | 377 | 437 | 497 | 558 | ||
| 1,03 | 5,0% | 237 | 301 | 364 | 428 | 491 | 555 | 618 | ||
| 1,08 | 10,0% | 279 | 346 | 413 | 479 | 545 | 612 | 678 | ||
| Recovery | Post-Tax NPV5% Sensitivity - Recovery & Gold Price | |||||||||
| % | 1400 | 1500 | 1600 | 1700 | 1800 | 1900 | 2000 | |||
| 82% | -10,0% | 108 | 163 | 218 | 274 | 328 | 383 | 437 | ||
| 86% | -5,0% | 151 | 209 | 267 | 325 | 383 | 440 | 497 | ||
| 91% | 0,0% | 194 | 255 | 316 | 377 | 437 | 497 | 558 | ||
| 95% | 5,0% | 237 | 301 | 364 | 428 | 491 | 555 | 618 | ||
| 100% | 10,0% | 279 | 346 | 413 | 479 | 545 | 612 | 678 | ||
| Cash Cost | Post-Tax NPV5% Sensitivity - Cash Cost & Gold Price | |||||||||
| US$/oz | $377 | 1400 | 1500 | 1600 | 1700 | 1800 | 1900 | 2000 | ||
| 771 | -10,0% | 248 | 309 | 369 | 430 | 490 | 551 | 611 | ||
| 814 | -5,0% | 221 | 282 | 343 | 403 | 464 | 524 | 584 | ||
| 857 | 0,0% | 194 | 255 | 316 | 377 | 437 | 497 | 558 | ||
| 900 | 5,0% | 167 | 228 | 289 | 350 | 410 | 471 | 531 | ||
| 943 | 10,0% | 140 | 201 | 262 | 323 | 384 | 444 | 505 | ||
| Capex | Post-Tax NPV5% Sensitivity - Capex & Gold Price | |||||||||
| US$m | $377 | 1400 | 1500 | 1600 | 1700 | 1800 | 1900 | 2000 | ||
| 182 | -10,0% | 208 | 269 | 330 | 390 | 450 | 511 | 571 | ||
| 192 | -5,0% | 201 | 262 | 323 | 383 | 444 | 504 | 564 | ||
| 202 | 0,0% | 194 | 255 | 316 | 377 | 437 | 497 | 558 | ||
| 212 | 5,0% | 187 | 248 | 309 | 370 | 430 | 491 | 551 | ||
| 222 | 10,0% | 180 | 241 | 302 | 363 | 424 | 484 | 544 | ||
Mineral Resources
The Mineral Resource was estimated for the
There has been no update of the geological nor mineralisation interpretations (wireframes), nor the estimate of gold grade in the block model. This Mineral Resource update is merely a restatement of the Mineral Resource using the same block model (as used in
A total of 69,063 m of drilling from 339 holes (34,957 m of diamond core from 125 holes and 34,105 m of RC from 214 holes) was completed at Twin Hills up until
A Mineral Resource is a concentration or occurrence of solid material of economic interest in or on the Earth’s crust in such form, grade or quality and quantity that there are reasonable prospects for eventual economic extraction (RPEEE). To satisfy the requirement of RPEEE by open pit mining, reporting pit shells were determined based on conceptual parameters and costs. Gold recovery will be achieved using a conventional crushing, milling, gravity, pre-oxidation and carbon-in-leach (CIL) circuit.
Material within the reporting pit shell was classified according to Mineral Resource confidence categories defined in CIM Definition Standards for Mineral Resources and Mineral Reserves. Data quality and quantity, geological and grade continuity, and confidence in the grade and density estimates, were considered when classifying the Mineral Resource. Mineral Resources are classified as either Inferred or Indicated. Indicated Mineral Resources have generally been classified where the mineralization is wide, suggesting good geological and grade continuity, and drill spacing is less than the general 50 m x 40 m grid.
The Mineral Resource is that material within the conceptual RPEEE pit shell above a 0.3 g/t Au cut-off grade. The Mineral Resource has an effective date of
Table 4: Mineral Resource for the
| Mineral Resource Category | Tonnes (Mt) | Grade (g/t Au) | Troy Ounces (Moz) | Bulk Density (t/m3) |
| Indicated | 14.0 | 0.98 | 0.44 | 2.75 |
| Inferred | 46.2 | 1.02 | 1.52 | 2.75 |
Notes:
- Figures have been rounded to the appropriate level of precision for the reporting of Mineral Resources.
- Mineral Resources are stated as in situ dry tonnes; figures are reported in metric tonnes.
- The Mineral Resource has been classified under the guidelines of the CIM Definition Standards for Mineral Resources and Mineral Reserves and adopted by the
CIM Council , and procedures for classifying the reported Mineral Resources were undertaken within the context of the Canadian Securities Administrators under NI 43-101. - The Mineral Resource is reported within a conceptual pit shell determined using a gold price of
US$1,700 /oz and conceptual parameters and costs to support assumptions relating to reasonable prospects for eventual economic extraction.- 4% royalty (3% government royalty and 1% export levy)
- Selling costs of
US$2.75 /oz - Mining costs of
US$2.00 /t mineralized material andUS$1.85 /t waste, with additional cost attributed to depth below surface - Processing and rehandling costs of
US$8.15 /t run of mine mineralized material - G&A cost of
US$4.00 /t run of mine mineralized material - Slope angle of 48° in weathered rock and 55° in fresh rock
- 90% gold recovery from CIL circuit
- Mineral Resources that are not Mineral Reserves do not have demonstrated economic viability.
- The exclusive exploration licenses constituting the
Twin Hills Project are owned 80%, 90% and 95% respectively by Osino. The total reported gold ounces attributable toOsino Resources is 93.05%.
The estimated block model was tabulated at various cut-off grades. This tabulation does not represent a Mineral Resource in any way and only serves to illustrate the nature of the mineralization and sensitivity to various cut-offs.
Table 5: Classified
| Cut-off Grade (g/t Au) | Indicated | Inferred | ||||
| Tonnes (Mt) | Grade (g/t Au) | Troy ounces (Moz) | Tonnes (Mt) | Grade (g/t Au) | Troy ounces (Moz) | |
| 0.3 | 14.0 | 0.98 | 0.44 | 46.2 | 1.02 | 1.52 |
| 0.4 | 13.7 | 0.99 | 0.44 | 43.8 | 1.06 | 1.49 |
| 0.5 | 13.5 | 1.00 | 0.43 | 42.6 | 1.08 | 1.47 |
| 0.6 | 12.8 | 1.02 | 0.42 | 40.6 | 1.10 | 1.44 |
| 0.7 | 11.2 | 1.08 | 0.39 | 36.2 | 1.16 | 1.35 |
| 0.8 | 9.3 | 1.14 | 0.34 | 30.4 | 1.23 | 1.21 |
| 0.9 | 7.3 | 1.22 | 0.29 | 24.9 | 1.32 | 1.05 |
| 1.0 | 5.4 | 1.32 | 0.23 | 19.7 | 1.42 | 0.90 |
Mine Design and Production Schedule
Tables 6 and 7 below summarizes the key mine design parameters and LOM production schedule. Note that a new pit design was created using costs and optimisation parameters generated by the PEA work. These costs are different to the costs used for the RPEEE pit shell which was generated for the maiden Mineral Resource as described in the April Technical Report.
Table 6:
| Parameter | Unit | Value |
| Minimum mining width (20 m + Single Ramp Width) | m | 35 |
| Minimum pushback width | m | 60 |
| Dual ramp width | m | 25 |
| Single ramp width | m | 18 |
| Minimum turning circle | M | 10 |
| Ramp Gradient (short and long ramps) | % | 8 to 10 |
| M | 10 | |
| Deg | 70 | |
| Berm Width | M | 4.20 |
| Max Benches per Stack | # | 5 |
| Stack angle - Crest to Toe – Fresh Rock | Deg | 50 |
| Stack Berm Width | M | 15 |
At steady state approximately 23 haul trucks (100-t) would be required with two shovels for selective loading whilst for bulk loading a maximum of five units would be required.
Table 7 accompanying this announcement is available at https://www.globenewswire.com/NewsRoom/AttachmentNg/18f10689-0d68-41ed-a97f-e49494faf381
Figure 6 accompanying this announcement is available at https://www.globenewswire.com/NewsRoom/AttachmentNg/2dcd5eaf-225b-4ae5-87a9-08314f565974
Figure 7 accompanying this announcement is available at https://www.globenewswire.com/NewsRoom/AttachmentNg/4ac85269-5cf5-4ffb-aae6-5f11ffc53fc7
Table 8 accompanying this announcement is available at https://www.globenewswire.com/NewsRoom/AttachmentNg/4dfd325e-b06a-477c-8bbd-c951b5fc7ece
Metallurgical Testwork
In 2020,
- Gravity recoverable gold testwork
- Grind vs recovery testwork
- Leach tests (with and without carbon)
- Preliminary heap leach investigation
- Leach kinetics testwork
Leach test work was conducted under the following conditions:
- 50% solids
- Target grind of 80% passing 75µm
- 1kg/t cyanide addition
- 24-hour leach time
- 20g/l carbon addition in the tests with carbon
Results from the first phase of test work indicated positive leach recoveries with pre-oxidation ranging from 84.2% to 90.1% at a grind size of 80% passing 75µm. Whilst these results were encouraging, and indicated the potential for a conventional leach circuit, it was decided to do a further Phase of testwork.
This Phase 3 test work was recently completed and confirms the benefit of pre-oxidation, with an average increase in gold recovery of approximately 10% for the fresh samples and 4% for the oxide samples at a grind size of 80% passing 75µm.
At a finer grind of 80% passing 53µm there was an average increase in gold recovery across all mineralized material types of about 5.3% compared to a grind size of 80% passing 75µm.
Average gold recovery results from samples at a grind size of 80% passing 53µm with pre-oxidation at different leach times were thus as follows:
Table 9: Gold Recovery Results at different Leach times
| Leach Retention Time | 24 Hour | 48 Hour | ||
| Fresh | 89.2 | % | 90.7 | % |
| Oxide | 92.1 | % | 93.9 | % |
Other process parameters are as follows:
- Comminution test work indicated that mineralized material is considered “medium to hard” with 3-stage crushing, followed by ball milling the likely optimal comminution configuration.
- Average comminution circuit power consumption estimated to be 14.9 kWh/t for 80% passing 75µm but increasing to circa 17.1kWh/t for the 80% passing 53µm grind.
- Initial gravity recovery test results were promising but not definitive.
The recovery used in the financial model is 90.9% which is the average recovery for all material types, believed to be achievable with the 80% passing 53um grind at 48 hours leach time. As this modified grind size was a later optimised step in the leach testwork program, the processing cost and the capital costs reflect the original calculations at 80% passing 75um grind size. The next phase of test work is being designed to confirm 80% passing 53µm is the optimal grind size, as well as updating the associated costs.
Heap leach test work was inconclusive as the samples were not coarse enough for standard size ranges, with particles in the region of 25 mm diameter. Bottle roll tests were therefore conducted on 90% passing 10mm and 80% passing 5mm. The results showed some leaching occurring and follow-up heap leach testwork at standard size ranges is currently underway.
Plant Mineral Processing
Gold recovery will be achieved using a conventional crushing, milling, gravity, pre-oxidation and carbon-in-leach (“CIL”) process plant flowsheet which is based on conventional unit operations well proven in the industry and will achieve high recoveries from all major rock types that are planned to be processed. The plant flow diagram is depicted in Figure 8 below.
Figure 8 accompanying this announcement is available at https://www.globenewswire.com/NewsRoom/AttachmentNg/61ad3d28-f351-4d60-9f0f-c677ca5ababb
Comminution will consist of three-stage crushing and ball milling. A bleed stream taken from the mill cyclone underflow will be processed in a gravity recovery circuit, followed by intensive leach of gravity concentrate.
The mill cyclone overflow product stream will be processed via a CIL circuit, carbon elution, electrowinning and a gold room. CIL tails will be treated to achieve cyanide destruction before being pumped to the tailing’s thickener, with the underflow being filtered. Filter cake will be conveyed and disposed of as tails in the tailings storage facility (“TSF”).
The key project design criteria for processing are:
- Nominal throughput of 3.5 million tonnes per annum
- Crushing plant availability of 70% and
- Plant availability of 91.3% overall, downstream of crushing
- 3-stage crushing and ball milling
- Cyclone classification to produce a leach feed with a grind size of 80% passing 75µm
- Gravity concentration on a portion of the cyclone underflow
- In-line leaching and electrowinning
- Pre-leach thickening (the classification cyclone overflow is expected to be fairly dilute)
- Pre-oxidation
- CIL leaching (preferred to leach/CIP in order to mitigate the risk of preg-robbing material in the mineralized material deposit)
- Elution, electrowinning and gold smelting to produce a dore bar
- Tailing’s detoxification to neutralise any cyanide that may be sent to the TSF and negate any environmental contamination.
Tailings storage is envisaged to occur via dry stack tailings deposition through co-disposal with waste rock after tailings thickening and filtration. This is recommended to recover the maximum amount of water from the tailings and return it to the process and will thus result in a lower water consumption than conventional tailings deposition.
The metallurgical and mineralized material processing studies have demonstrated the Project to be viable and attractive for development.
Site Location and Infrastructure
The Project is located within 5km’s of the sealed national highway network, within 20km’s of a major high tension overhead power line and within 220km’s of the modern seaport of
The anticipated infrastructure for the Project includes mine dry facilities, equipment maintenance workshop, refuelling facilities, explosive magazine, office administration facilities, assay laboratory, and warehouse facilities. As well as access roads, stockpiling areas, storm water handling facilities, water supply, power supply network, diesel generators, sewage treatment plant, and waste management facilities. Given the Project’s proximity to the town of Karibib, it is assumed that no onsite accommodations will be required. Accommodations for expatriate and some senior staff may be provided through rental houses in the town of Karibib.
The Project power demand has been estimated at 15MW, which will be supplied from the Namibian grid by a high-voltage overhead powerline to the site switchyard. The national grid connects to the town of Karibib with a 66kV line, which also supplies the Navachab gold mine. Osino has recently made an application to the national power utility to connect the planned operation into the high voltage power grid.
The Project is located in arid shrub land and is characterised by moderate relief with local elevations ranging from 900 m to 1,500 m above sea level. The primary economic activities in the Project area are agricultural (cattle ranching and game farming). Local elevations or hills in the Project area are generally associated with marble outcrops and granitic intrusions.
Various site visits by the Project team have been conducted in early 2021 in conjunction with preliminary civil engineering investigations which have found that the site is characterised by:
- Flat topography providing space for the placement of mine infrastructure around the proposed pits.
- An extensive calcrete horizon which provides a stable foundation for equipment.
- The calcrete is overlain by a veneer of Kalahari sands 1 to 2m deep in the western area of the Project.
Field investigations have informed the PEA site layout with alternative options for plant, waste dumps and tailings facility. A strategy of centralising the plant and waste areas to the northwest of the Twin Hills main pit has resulted in a robust infrastructure layout which is now believed to be near optimal for the Project, with detailed layout to be completed during the next stage of feasibility study.
Refer to Figure 9 below for the detailed site layout.
Water Supply
The Project area rainfall and evaporation rates determined from records at Karibib, show the average annual rainfall as 217 mm, while the evaporation is 2,242 mm/yr. Rainfall occurs almost exclusively from December through April, with occasional showers in November. Several mostly ephemeral watercourses flow across the Project site to meet the
The process design aims to maximise the re-use of water by recycling process solutions wherever possible through filtration systems in the plant. Some water is inevitably lost to tailings and through evaporation and it is envisaged that the 3.5mtpa plant will require ~1.5 million m3pa. This deficit will be made up from raw water derived from mine dewatering as well as water supply boreholes.
Borehole drilling has identified significant aquifers in the marble horizons and pump testing is ongoing to determine the sustainable yields of these holes. Surface water may be required to supplement groundwater to meet the Project water balance demands, and potential dam sites within sand aquifers are being considered along the
An application has also been made to Namwater to supply any possible shortfall in supply with bulk raw water from the Swakoppoort Dam’s existing pipeline connection with Karibib, which also supplies the
Figure 9 accompanying this announcement is available at https://www.globenewswire.com/NewsRoom/AttachmentNg/9740c732-1b8d-46e0-b3b8-aaacaac13220
Environmental and CSR
An independent environmental consultancy in
Baseline studies for the Project area are targeting biotic and abiotic factors relating the Project and the findings of scoping specialist studies as well as issues and concerns raised at stakeholder and public meetings planned to be held in Q3 2021 will be presented in the ESIA report in
During the PEA scoping study, none of the impacts identified are considered as fatal flaws and any high significance impacts will be reduced after implementation of mitigation measures.
Capital & Operating Costs
The Project capital cost estimate was compiled by
Table 10: Capital Cost Estimate Summary
| Capital Cost Estimate | Unit | Capital Cost | |
| 1 | Treatment Plant Costs | US$m | 70,1 |
| 2 | Reagents & Plant Services | US$m | 7,2 |
| 3 | Infrastructure | US$m | 20,0 |
| 4 | Mining | US$m | 15,6 |
| 5 | Preliminaries and General | US$m | 20,1 |
| 6 | Indirects | US$m | 7,6 |
| 7 | Opening Stock | US$m | 2,0 |
| 8 | EPCM | US$m | 20,6 |
| 9 | Owners Costs | US$m | 12,5 |
| Total capital cost excl. contingency | US$m | 175,7 | |
| 10 | Estimated Contingency @ 15% | US$m | 26,0 |
Process operating costs have been developed by
Processing operating costs have been developed for a plant with an annual throughput equivalent to 3.5mtpa of fresh mineralized material plant feed at a grind size of 80% passing 75 µm, based on a 24 hour per day operation, 365 days per year. Additional work will confirm the processing costs associated with 80% passing 53µm grind.
Table 11: Processing Cost Estimate
| LOM Blend | ||
| Proportion of LOM | 100% | |
| 3,500,000 | ||
| Cost Centre | US$m/year | US$/t |
| Power | 10,8 | 3.08 |
| Operating Consumables | 13,4 | 3.82 |
| Maintenance | 4,0 | 1.15 |
| Laboratory | 0,6 | 0.16 |
| Process Plant Labour | 2,7 | 0.76 |
| Total Processing | 31,4 | 8.97 |
Mining operating costs were estimated based on the envisaged mining contractor’s selected equipment fleet and organisational structure. The estimate was done from first principles, using the original equipment manufacturers (“OEM”) hourly life cycle cost estimates with the simulated production rates for the primary mining equipment.
The unit operating cost estimates thus derived are summarized in table 12 below:
Table 12: Operating Cost Estimate Summary
| Item | Unit | Unit Cost |
| Processing | US$/t processed | 8.97 |
| Mining (average waste & mineralized material) | US$/t mined | 2.08 |
| Mining (average waste & mineralized material) | US$/t processed | 12.48 |
| Administration | US$/t processed | 3.00 |
Site administration costs have been estimated to be approximately UD$10.5m per year based on similar sized operations in
Opportunities & Risks
A number of significant project opportunities have been identified as part of this PEA, including the following:
- Conversion of Inferred to Indicated and/or Measured Mineral Resources would result from improved mineralisation models and grade estimates as a result of additional drilling.
- The conceptual pit shell generated to report the Mineral Resource resulted in the entire block model satisfying RPEEE. This suggests that undrilled material at depths below the RPEEE pit shell could potentially satisfy RPEEE requirements, and that the deposit is effectively open with depth.
- The step out drill program that is currently underway will be reflected in an updated Mineral Resource and Technical Report to be issued upon conclusion of this drill program, likely during H1 2022.
- Ongoing metallurgical testwork especially in terms of optimal grind size and leach kinetics should result in an optimized and improved process layout which could result in improved overall gold recovery.
- The mine design has significant potential to be improved by optimizing the pit and mine design and production schedule. For example, a reduction in the number of in-pit ramps could result in steeper slope angles, resulting in lower stripping, lower costs and therefore improved economics, and therefore also likely a deeper pit. Reducing the number of in-pit ramps could be justified on the basis of scheduling flexibility due to having three discrete pits as mineralized material sources.
- An increase in the mining rate beyond 25mtpa could result in more and higher-grade mineralized material reporting to the processing plant earlier, thereby improving the project economics.
- The on-going brownfields exploration program on the numerous occurrences and targets delineated along the
Karibib Fault Zone suggests the possibility of additional gold resource discoveries along strike from Twin Hills which would result in further resource growth and concomitant improvement in project economics. - The dry nature of the surrounding area and the limited water supply options in this region of
Namibia suggests that the key project risk would be water-supply. In order to mitigate this risk Osino is presently engaged in an extensive hydro-geological assessment phase to demonstrate alternative and sustainable water supply options for the project.
Interpretation and Conclusions
Lycopodium’s conclusion was that the Twin Hills Gold Project PEA is a low technical risk conventional open pit mine and carbon-in-leach processing facility with a flowsheet which is based on unit operations that are proven in industry.
An economic analysis of the mine schedule generated from the PEA resource model has shown financial viability of the project at a gold price of
A review of the outcomes of the PEA analysis indicates that the project is robust and has no fatal flaws, and it is therefore recommended that the project is progressed to the feasibility study level.
Presentation & Investor Webinar
Osino will host an investor webinar to discuss the PEA on
After registering, you will receive a confirmation email containing details to access the webinar via conference call or webcast. The replay will also be available on Osino’s website.
A presentation to accompany the webinar will be available on the Company’s website.
Qualified Persons & Technical Report
Mr
Mr
Mr
About
About
Osino is a Canadian gold exploration and development company focused on the advancement of the Twin Hills gold project in central
Osino also has a large ground position of approximately 6,700km2 located within Namibia’s prospective Damara sedimentary mineral belt, mostly in proximity to and along strike of the producing Navachab and Otjikoto Gold Mines. The Company is actively advancing a range of other gold prospects and targets along the belt by utilizing a portfolio approach geared towards discovery, targeting gold mineralization that fits the broad orogenic gold model.
Our core projects are favorably located in central and northern
Osino continues to evaluate new ground with a view to expanding our Namibian portfolio.
Further details are available on the Company's website at https://osinoresources.com/
CONTACT INFORMATION
Tel: +1 (604) 785 0850
jbecker@osinoresources.com
Cautionary Statement Regarding Forward-Looking Information
This press release contains "forward-looking information" within the meaning of applicable Canadian securities legislation. Forward-looking information includes, without limitation, statements regarding the use of proceeds from the Company's recently completed financings, and the future plans or prospects of the Company, including prospects for economic recoverability of mineral resources. Generally, forward-looking information can be identified by the use of forward-looking terminology such as "plans", "expects" or "does not expect", "is expected", "budget", "scheduled", "estimates", "forecasts", "intends", "anticipates" or "does not anticipate", or "believes", or variations of such words and phrases or state that certain actions, events or results "may", "could", "would", "might" or "will be taken", "occur" or "be achieved". Forward-looking statements are necessarily based upon a number of assumptions that, while considered reasonable by management, are inherently subject to business, market and economic risks, uncertainties and contingencies that may cause actual results, performance or achievements to be materially different from those expressed or implied by forward-looking statements. Although the Company has attempted to identify important factors that could cause actual results to differ materially from those contained in forward-looking information, there may be other factors that cause results not to be as anticipated, estimated or intended. There can be no assurance that such information will prove to be accurate, as actual results and future events could differ materially from those anticipated in such statements. Accordingly, readers should not place undue reliance on forward-looking information. Other factors which could materially affect such forward-looking information are described in the risk factors in the Company's most recent annual management's discussion and analysis which is available on SEDAR at www.sedar.com. The Company does not undertake to update any forward-looking information, except in accordance with applicable securities laws.
The results of this PEA are based on the material assumptions outlined herein and in the Technical Report that will comprise the PEA, which will be published within 45 days of the date hereof. These include assumptions about the availability of funding. While Osino considers all of the material assumptions to be based on reasonable grounds, there is no certainty that they will prove to be correct or that the range of outcomes indicated by the results of the PEA will be achieved. To achieve the range of outcomes indicated by the results of the PEA, among other things, funding of in the order of
Neither the

Figure 1
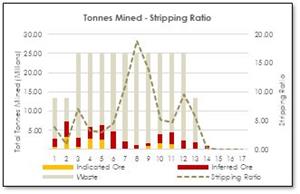
Total Tonnes Mined & Stripping Ratio
Figure 2
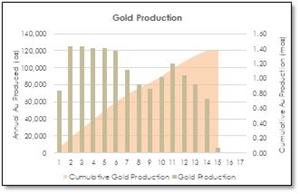
Annual and Cumulative Gold Production
Figure 3
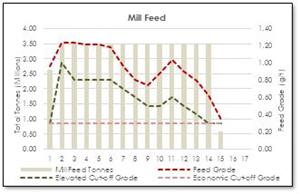
Mill Feed and Grade
Figure 4

Stockpile Balance
Figure 5
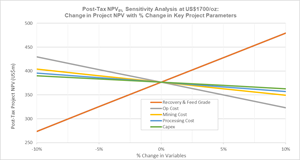
Post-Tax Project NPV Sensitivity to Variations in Key Project Parameters at US$1700 /oz
Table 7
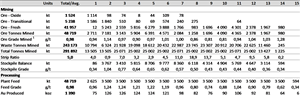
LOM Production Schedule
Figure 6
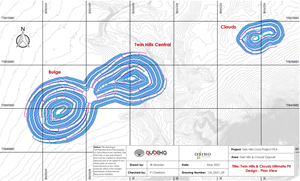
Detailed Mine Design Planview for Bulge, Twin Hills Central and Clouds Pits
Figure 7
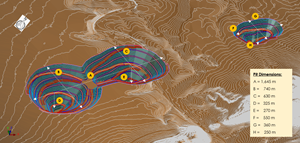
Pit Dimensions and Isometric View for Bulge, Twin Hills Central and Clouds Pits
Table 8
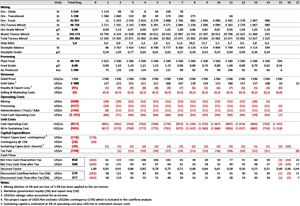
LOM Production Schedule
Figure 8
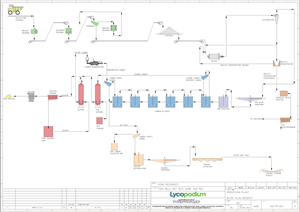
Twin Hills Gold Project Process Plant Flow Diagram
Figure 9
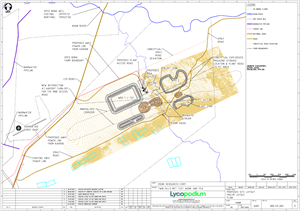
Preliminary Site Layout
2021 GlobeNewswire, Inc., source

