The Company will host a PEA focused webinar on
https://us02web.zoom.us/webinar/register/WN_qTXgGycAQLOBbTxXBN2B6A
Wildcat & Mountain View PEA Highlights:
- After-tax NPV(5%) of
US$309.6 million (“M”) (C$408.6M 1) and 36.9% after-tax IRR using base case metal prices ofUS$1,700 /oz gold (“Au”) andUS$21.50 /oz silver (“Ag”) - After-tax NPV(5%) of
US$442.1M (C$583.6M 1) and 49.7% after-tax IRR using spot metal prices onJune 27, 2023 ofUS$1,920 /oz Au andUS$22.00 /oz Ag - Wildcat & Mountain View generate combined annual production of ~94koz AuEq from year 1-5 with average annual production of 80koz AuEq over the 13 year Life-of-Mine (“LOM”)
- LOM payable metals from Wildcat & Mountain View of 1,043koz AuEq
- LOM site level cash costs of
US$882 /oz AuEq on a co-product basis; LOM site level all-in sustaining cash costs (“AISC”) ofUS$973 /oz AuEq on a co-product basis - Year -1 initial capex of
US$115M to begin operations at Wildcat - Average Au Recovery of 71.4% at Wildcat and 77.1% at Mountain View
- Low combined LOM strip ratio of 1.21 (Wildcat standalone strip ratio of 0.28)
- Total net free cash flow generated of
US$485M over the LOM with average net annual free cash flow ofUS$46M from year 1-13 - The updated mineral resource estimate at Wildcat & Mountain View demonstrates growth of +23% and +49% respectively compared to the previous mineral resource estimates dated
November 2020 :- 2021-2022 drilling at Wildcat & Mountain View allowed the Company to convert the majority of the previous resource estimate from the Inferred (“Inf.”) category to the Indicated (“M&I”) category
Wildcat Project : 746koz Au and 6,438koz Ag (829kozs AuEq) in M&I (59,872,806 tonnes at 0.39 g/t Au and 3.34 g/t Ag) and 210koz Au and 1,980koz Ag (235kozs AuEq) in Inf. (22,455,848 tonnes at 0.29 g/t Au and 2.74 g/t Ag)Mountain View Project : 578koz Au and 3,402koz Ag (622kozs AuEq) in M&I (28,750,517 tonnes at 0.63 g/t Au and 3.68 g/t Ag) and 60koz Au and 244koz Ag (63kozs AuEq) in Inf. (4,155,502 tonnes at 0.45 g/t Au and 1.83 g/t Ag)
- 2021-2022 drilling at Wildcat & Mountain View allowed the Company to convert the majority of the previous resource estimate from the Inferred (“Inf.”) category to the Indicated (“M&I”) category
- The PEA results complement the 2022 Pre-feasibility Study for the
DeLamar Project in southwesternIdaho , which demonstrated a base case after-tax NPV(5%) ofUS$314M and a 33% after-tax IRR2
(1) CAD:USD FX rate of 1.32
(2) See NI 43-101 technical report titled: “Technical Report and Preliminary Feasibility Study for the DeLamar and Florida Mountain Gold – Silver project,
Integra’s President, CEO & Director,
The PEA is preliminary in nature and includes inferred mineral resources that are too speculative geologically to have economic considerations applied to them that would enable them to be categorized as mineral reserves. There is no certainty that PEA results will be realized. Mineral resources are not mineral reserves and do not have demonstrated economic viability.
Project Economics - Sensitivity to Gold and Silver Prices
Table 1 illustrates a range of metal price scenarios to evaluate the after-tax economics of Wildcat & Mountain View. As shown, Wildcat & Mountain View operations remain viable in the downside commodity price scenario and also show robust economics in the upside case.
Table 1: After-Tax NPV, IRR and Payback Sensitivity Table (US$M)
| $/oz Au | $/oz Ag | NPV (5%) | NPV (7.5%) | NPV (10%) | IRR | Payback | |||||
| 21.2% | 3.7 | ||||||||||
| 24.4% | 3.5 | ||||||||||
| 27.6% | 3.3 | ||||||||||
| 30.7% | 3.2 | ||||||||||
| 33.7% | 3.1 | ||||||||||
| $1,700 | $21.50 | $309.6 | $249.3 | $201.2 | 36.9% | 3.0 | |||||
| 39.9% | 2.8 | ||||||||||
| 42.9% | 2.6 | ||||||||||
| 45.9% | 2.5 | ||||||||||
| 48.8% | 2.4 | ||||||||||
| 51.7% | 2.3 | ||||||||||
Production and Cash Flow Profile
The PEA outlines a profitable heap leach operation with a phased development approach that sees production beginning at Wildcat and expanding to Mountain View in year 8. A phased development approach allows the Company to utilize one fleet for mining and processing equipment resulting in significantly reduced total capital requirements. In total, the approximately 30,000 tonnes per day (“tpd”) heap leach operation at Wildcat and 16,000 tpd heap leach operation at Mountain View is expected to process 99.5 million tonnes (“Mt”) of mineralized material and produce 1,043koz AuEq (1,018koz Au and 1,933koz Ag) over the 13-year LOM.
The average annual LOM production at Wildcat & Mountain View is expected to be 80koz AuEq per year which, assuming base case metal prices of
Figure 1: Wildcat & Mountain View Production Profile
Figure 2: Wildcat & Mountain View Cash Flow Profile
Technical Inputs and Assumptions
Each of Wildcat & Mountain View will have its own heap leach pad and waste rock facility. The mining equipment and fleet will be moved between the two projects to provide efficient operations and value optimization. Wildcat & Mountain View will share an Adsorption/Desorption/Recovery (“ADR”) plant located first at Wildcat and then moved to Mountain View in year 8, at which point the loaded carbon from production years 8 and 9 at Wildcat will be trucked to Mountain View for processing. Mining will be done using 90 tonne (“t”) haul trucks and 200t and 250t shovels. Material will be crushed to 9 millimeters (“mm”) at Wildcat and 19mm at Mountain View using a three-stage crushing circuit. No agglomeration is expected to be required at either project.
Table 2: Standalone Project Inputs
| Mining | Wildcat | Mountain View |
| Total Tonnage Mined (kt) | 89,909 | 130,279 |
| Total Mineralized Material (kt) | 69,974 | 29,548 |
| Strip Ratio (Waste: Mineralized) | 0.28 | 3.41 |
| Contained | ||
| Contained Gold (koz Au) | 823.1 | 521.8 |
| Contained Silver (koz Ag) | 7,065.8 | 3,037.2 |
| Contained Gold Equivalent (koz AuEq) | 912.4 | 560.2 |
| Processing & Grade | ||
| Processing Throughput (ktpd) | 30.0 | 16.0 |
| Average Gold Grade (g/t Au) | 0.38 | 0.57 |
| Average | 3.25 | 3.30 |
| Production | ||
| Heap Leach Recovery | ||
| LOM Average Gold Recovery (%) | 71.4% | 77.1% |
| LOM Average Silver Recovery (%) | 18.0% | 20.0% |
| Payable Metals | ||
| LOM Gold Payable (koz Au) | 604.2 | 414.0 |
| LOM Silver Payable (koz Ag) | 1,308.1 | 624.8 |
| LOM Gold Equivalent Payable (koz AuEq) | 620.8 | 421.9 |
Table 3: Technical Inputs and Financial Assumptions for Combined Operation
| Mining | Wildcat & Mountain View |
| Total Tonnage Mined (kt) | 220,187 |
| Total Mineralized Material (kt) | 99,522 |
| Strip Ratio (Waste: Mineralized) | 1.21 |
| 13.0 | |
| Contained | |
| Contained Gold (koz Au) | 1,344.9 |
| Contained Silver (koz Ag) | 10,103.0 |
| Contained Gold Equivalent (koz AuEq) | 1,472.7 |
| Production | |
| Heap Leach Recovery | |
| LOM Average Gold Recovery (%) | 73.7% |
| LOM Average Silver Recovery (%) | 18.6% |
| Payable Metals | |
| LOM Gold Payable (koz Au) | 1,018.2 |
| LOM Silver Payable (koz Ag) | 1,932.8 |
| LOM Gold Equivalent Payable (koz AuEq) | 1,042.6 |
| Average Annual Gold Payable (koz Au) | 78.3 |
| Average Annual Silver Payable (koz Ag) | 148.7 |
| Average Annual Gold Equivalent Payable (koz AuEq) | 80.2 |
| Costs per Tonne | Wildcat & Mountain View |
| Mining Costs (US$/t mined) | |
| Mining Costs (US$/t processed) | |
| Processing Costs (US$/t processed) | |
| G&A Costs (US$/t processed) | |
| Total Site Operating Cost (US$/t processed) | |
| Cash Costs | |
| LOM Cash Cost, net-of-silver by-product ($/oz Au) | |
| LOM Cash Cost, co-product ($/oz AuEq) | |
| LOM AISC, net-of-silver by-product ($/oz Au) | |
| LOM AISC, co-product ($/oz AuEq) | |
| LOM AIC, net-of-silver by-product ($/oz Au) | |
| LOM AIC, co-product ($/oz AuEq) | |
| Capital Expenditure | |
| Wildcat Initial Capex (US$M) (1) | |
| Mountain View Initial Capex (US$M) | |
| Expansion Capex (US$M) (2) | |
| Sustaining Capex / Equipment Financing (US$M) | |
| Reclamation Cost (US$M) | |
| Salvage Value (US$M) | ( |
| Bonding Cash Collateral Return (US$M) | ( |
| Total Capital (US$M) | |
| Economic Assumptions | |
| Gold Price (US$/oz) | |
| FX Rate (CAD/USD) | 1.3 |
| Project Economics | |
| After-Tax IRR (%) | 36.9% |
| After-Tax NPV5% (US$M) | |
| After-Tax NPV5% (C$M) | |
| Payback Period (years) | 3.0 |
| Yr1-13 Average Annual | |
| Yr1-13 Total | |
| LOM Total |
(1) Includes initial working capital and reclamation bonding
(2) Includes Wildcat and Mountain View heap leach expansion capex
Capital & Operating Costs
The total site costs including mining, processing and G&A for Wildcat & Mountain View are
Table 4: Operating Cost, AISC and AIC Breakdown
| Per Tonne | ||||
| LOM Operating Costs (US$) | Mined | Processed | ||
| Mining | ||||
| Processing | ||||
| G&A | ||||
| Total Site Costs | $8.19 | |||
| US$/oz Au | US$/oz AuEq | |||
| LOM Cash Costs, AISC & AIC Breakdown | By-Product | Co-Product | ||
| Mining | ||||
| Processing | ||||
| G&A | ||||
| Total Site Costs | $801 | $782 | ||
| Transport & Refining | ||||
| Royalties & Production Taxes (1) | ||||
| Total Cash Costs | $903 | $882 | ||
| Silver By-Product Credits | ( | - | ||
| Total Cash Costs Net of Silver by-Product | $862 | $882 | ||
| Sustaining Capital | ||||
| Closure Costs Net of Residual Value | ||||
| Site Level All-in Sustaining Costs | $956 | $973 | ||
| Site Level All-in Costs | $1,162 | $1,175 | ||
(1) Includes private royalties and state-level cash taxes
(2) Expansion capital includes heap leach expansion at Wildcat in year 2 and Mountain View in year 9
(3)
Note: Costs may not reconcile exactly due to rounding
The total pre-production capex for Wildcat is estimated at
Table 5: Wildcat & Mountain View Project Capital Cost Breakdown
| Capital Cost Breakdown (US$M) | Wildcat | Mountain View | Combined | |||||
| Heap Leach Pad | ||||||||
| Processing | ||||||||
| Initial Cash Bonding | ||||||||
| Contingency | ||||||||
| $115.1 | $0.0 | $115.1 | ||||||
| Heap Leach Pad | ||||||||
| Processing | ||||||||
| Contingency | ||||||||
| $0.0 | $49.2 | $49.2 | ||||||
| Heap Leach Pad | ||||||||
| Contingency | ||||||||
| $31.0 | $18.2 | $49.2 | ||||||
| Other Capital ( | ||||||||
| Mining Equipment | ||||||||
| Sustaining Capital | ||||||||
| Reclamation | ||||||||
| Bonding Cash Collateral Return | ( | ( | ||||||
| Residual Value | ( | |||||||
| $64.5 | $39.4 | $91.9 | ||||||
| TOTAL CAPITAL | $210.6 | $106.8 | $305.3 | |||||
Note: Figures in the table include a ~25% contingency on processing facilities and heap leach pads (excluding working capital)
Additional Information
Mining
As contemplated in the PEA study, approximately 200 mining, processing, maintenance, and general administrative workers are expected to be employed directly by Wildcat & Mountain View in peak years. In addition, Wildcat & Mountain View will contribute to the state and federal governments through taxation.
The PEA utilizes a phased development and mining approach with open pit mining beginning at Wildcat and moving to Mountain View in year 8.
The average waste to mineralization strip ratio at Wildcat is 0.28 and is 3.41 at Mountain View. The LOM strip ratio for Wildcat & Mountain View is 1.21 with approximately
Integra contemplates conducting open pit mining at Wildcat & Mountain View using an owner-operated, conventional mine fleet that includes production drill rigs for mineralization definition and blasting. The operation will share mining equipment and a fleet that includes ~28 to ~33 cubic meter hydraulic shovels (200t and 250t shovels) and ~12 cubic meter front end loaders with 90t haul trucks. The Company intends to optimize equipment use by moving equipment, after a rebuild program, from Wildcat to Mountain View as production declines at Wildcat and ramps up at Mountain View in years 7 and 8.
Heap Leach Metallurgy
The PEA includes conventional heap leaching for the processing and recovery of gold and silver. A heap leach pad will be located at both Wildcat and Mountain View with a shared ADR plant located first at Wildcat and then moved to Mountain View. Mineralized material will be crushed to 9mm at Wildcat and 19mm at Mountain View using three stage crushing and will be placed on the pad using traditional conveyor and grasshopper stacking systems. At both projects, gold and silver will be leached using a low concentration sodium cyanide solution and recovered using an ADR plant to produce doré on site.
At Wildcat, 70Mt of mineralized material will be placed on the heap leach pad. The average gold and silver recoveries are 71.4% Au and 18.0% Ag resulting in total payable sales of 604koz Au and 1.3Moz Ag. At Mountain View, 30Mt of mineralized material will be placed on the heap leach pad. The average gold and silver recoveries are 77.1% Au and 20.0% Ag, resulting in total payable ounces of 414koz Au and 625koz Ag.
Wildcat & Mountain View Project Resource Estimates
The following table highlights the updated resource estimates for Wildcat & Mountain View that were used in the PEA study. The updated resource estimates were completed by
Table 6: Wildcat & Mountain View Mineral Resources
| Wildcat | ||||||||
| Tonnes | g/t Au | oz Au | g/t Ag | oz Ag | g/t AuEq | oz AuEq | ||
| Oxide | Indicated | 59,872,806 | 0.39 | 746,297 | 3.34 | 6,437,869 | 0.43 | 829,152 |
| Inferred | 22,455,848 | 0.29 | 209,662 | 2.74 | 1,980,129 | 0.33 | 235,146 | |
| Mountain View | ||||||||
| Tonnes | g/t Au | oz Au | g/t Ag | oz Ag | g/t AuEq | oz AuEq | ||
| Oxide | Indicated | 22,007,778 | 0.57 | 401,398 | 2.46 | 1,738,448 | 0.60 | 423,772 |
| Inferred | 3,579,490 | 0.44 | 50,716 | 1.43 | 165,049 | 0.46 | 52,840 | |
| Transition | Indicated | 2,804,723 | 0.66 | 59,676 | 6.56 | 591,868 | 0.75 | 67,293 |
| Inferred | 215,815 | 0.40 | 2,750 | 3.77 | 26,184 | 0.44 | 3,087 | |
| Non-Oxide | Indicated | 3,938,017 | 0.92 | 116,970 | 8.46 | 1,071,521 | 1.03 | 130,760 |
| Inferred | 360,198 | 0.58 | 6,679 | 4.57 | 52,955 | 0.64 | 7,361 | |
| Total | Indicated | 28,750,517 | 0.63 | 578,044 | 3.68 | 3,401,836 | 0.67 | 621,826 |
| Inferred | 4,155,502 | 0.45 | 60,145 | 1.83 | 244,188 | 0.47 | 63,288 | |
(1) Mineral Resources that are not Mineral Reserves do not have demonstrated economic viability.
(2)
(3) The estimate is reported for open-pit mining scenario and with reasonable assumptions. The cut-off grade of 0.15 g/t Au was calculated using a gold price of
(4) Rounding as required by reporting guidelines may result in apparent discrepancies between tonnes, grades, and contained metal content.
(5) The estimate of mineral resources may be materially affected by geology, environment, permitting, legal, title, taxation, sociopolitical, marketing, or other relevant issues.
Mineral Resource
As part of the PEA, Integra completed an updated resource estimate for Wildcat & Mountain View. This resource update incorporates drilling from the 2021-2022 drill programs and is based on a new geological interpretation for both the lithological and oxidation models. In addition to new drilling, which included twinning of historical drill holes, the relogging and re-assaying of the available historical data provided enough information to upgrade most of the resources into the Indicated category. Classification of the resources was interpreted manually considering various information such as geology, grade and recovery continuity as well as interpolation parameters and drilling spacing. The Company utilized a general guideline of 50m by 50m spacing for the Indicated resource and 100m by 100m for the Inferred resource. The resources were then constrained using Lerchs-Grossmann pit optimization to respect the definition of reasonable prospects for economic extraction. The updated resource estimate saw an increase in total in-pit AuEq ounces driven primarily by the drilling that took place in 2021-2022 which allowed for the re-interpretation of the oxidation profile at Wildcat and a better constraint of the high-grade breccia body at Mountain View, new geotechnical parameters and metallurgical recoveries, and a higher Au price assumption. As a result of this geological and modeling work, approximately 80% of the resources for Wildcat & Mountain View are now classified as Indicated.
The Company utilized the resource estimate block model described above as a basis for the PEA study, however, additional ‘modifying factors’ were considered for the PEA. These factors included Au prices and pit designs, among others. The modifying factors in the PEA led to a substantial difference between the mineral resource estimate and the PEA production plan.
Wildcat & Mountain View: Future Opportunities and Value Enhancements
Through the course of conducting exploration and various studies related to the PEA work, the Company has identified several prospective measures to grow the mineral resource estimate at Wildcat & Mountain View and enhance future economics:
- Exploration Upside:
Wildcat has significant exploration potential. To date, exploration at Wildcat has been constrained by a 5-acre area of surface disturbance with regard to drill permitting. In late 2022, the Company filed for an Exploration Plan of Operations (“EPO”) that would increase the surface disturbance to 400-acres. This increased area of disturbance would allow the Company to test drill ready targets outside the current resource boundary.
InNovember 2022 , a surface sampling and mapping program identified several new mineralized targets outside the proposed PEA pit area at Wildcat. This increased the mineralized footprint from ~1.5 kilometres (“km”) by 1.5 km to ~3.0 km by 2.0 km and identified multiple high-priority drill ready targets that have the potential to increase the resource at Wildcat.
- Metallurgy:
Through metallurgical test work completed for the PEA, the Company has identified areas where further optimization could potentially increase recoveries and/or lower costs. At Wildcat, further optimizing crush size while focusing on better solution permeability has the potential to increase gold recoveries on the heap leach pad. At Mountain View, recoveries are less sensitive to crush size suggesting the potential to decrease crushing requirements and lower costs.
- Mining Upside:
Short haulage distances and the use of conveyor systems has helped reduce the mining costs at Wildcat & Mountain View. Additional sequencing optimization at Wildcat has the potential to further maximize in-pit dumping and provide future cost savings. Further metallurgical testwork to better define the mineralized material blending requirements could also have a positive impact on the annual production profile. Studies are also underway at Wildcat to evaluate the potential of generating power on the downward conveying of material from the open pit to the heap leach pad. The potential power generated could reduce plant operating costs.
Next Steps
Based on the positive results of the PEA, Integra will continue to de-risk Wildcat & Mountain View through baseline and technical studies in the areas of hydrology, geotechnical and metallurgy. Once the EPO is received, the Company is expected to undertake an exploration drill program to grow the resource at the Wildcat & Mountain View which could increase the mine life and further enhance the robust economics outlined in the PEA.
The PEA was prepared by
Qualified Persons
The scientific and technical information contained in this news release has been reviewed and approved by Raphael Dutaut, Ph.D (
The scientific and technical information contained in this news release has also been verified and approved by the following “Qualified Persons” within the meaning of NI 43-101 – Standards of Disclosure for Mineral Projects:
About
Integra is one of the largest precious metals exploration and development companies in the
ON BEHALF OF THE BOARD OF DIRECTORS
President, CEO and Director
CONTACT INFORMATION
Corporate Inquiries: ir@integraresources.com
Company website: www.integraresources.com
Office phone: 1 (604) 416-0576
Forward Looking and Other Cautionary Statements
Certain information set forth in this news release contains “forward‐looking statements” and “forward‐looking information” within the meaning of applicable Canadian securities legislation and applicable
There can be no assurance that forward‐looking statements will prove to be accurate, as actual results and future events could differ materially from those anticipated in such statements. The Company undertakes no obligation to update forward‐looking statements if circumstances or management’s estimates or opinions should change except as required by applicable securities laws. The forward-looking statements contained herein are presented for the purposes of assisting investors in understanding the Company’s plans, objectives and goals and may not be appropriate for other purposes. Forward-looking statements are not guarantees of future performance and readers are cautioned not to place undue reliance on forward‐looking statements. This news release also contains or references certain market, industry and peer group data which is based upon information from independent industry publications, market research, analyst reports and surveys and other publicly available sources. Although the Company believes these sources to be generally reliable, such information is subject to interpretation and cannot be verified with complete certainty due to limits on the availability and reliability of raw data, the voluntary nature of the data gathering process and other inherent limitations and uncertainties. The Company has not independently verified any of the data from third party sources referred to in this news release and accordingly, the accuracy and completeness of such data is not guaranteed.
Cautionary Note for U.S. Investors Concerning Mineral Resources and Reserves
National Instrument 43-101 - Standards of Disclosure for Mineral Projects is a rule of the Canadian Securities Administrators which establishes standards for all public disclosure an issuer makes of scientific and technical information concerning mineral projects. Technical disclosure contained in this news release has been prepared in accordance with NI 43-101 and the
All references to “$” in this news release are to
Cautionary Note Regarding Non-GAAP Financial Measures
Alternative performance measures in this news release such as “cash cost”, “AISC” “free cash flow” are furnished to provide additional information. These non-GAAP performance measures are included in this news release because these statistics are used as key performance measures that management uses to monitor and assess performance of Wildcat & Mountain View, and to plan and assess the overall effectiveness and efficiency of mining operations. These performance measures do not have a standard meaning within International Financial Reporting Standards (“IFRS”) and, therefore, amounts presented may not be comparable to similar data presented by other mining companies. These performance measures should not be considered in isolation as a substitute for measures of performance in accordance with IFRS.
Cash Costs
Cash costs include site operating costs (mining, processing, site G&A), refinery costs and royalties, but excludes head office G&A and exploration expenses. While there is no standardized meaning of the measure across the industry, the Company believes that this measure is useful to external users in assessing operating performance.
All-In Sustaining Cost
Site level AISC include cash costs and sustaining and expansion capital, but excludes head office G&A and exploration expenses. The Company believes that this measure is useful to external users in assessing operating performance and the Company’s ability to generate free cash flow from potential operations.
All-In Cost
Site level AIC includes AISC level costs and also includes initial capital and equipment finance costs associated with initial capital. The Company believes that this measure is useful to external users in assessing the Company’s overall ability to generate free cash flow from potential operations.
Free Cash Flow
Free cash flows are revenues net of operating costs, royalties, capital expenditures and cash taxes. The Company believes that this measure is useful to the external users in assessing the Company’s ability to generate cash flows from the Project.
Neither the
Photos accompanying this announcement are available at:
https://www.globenewswire.com/NewsRoom/AttachmentNg/9d0b9616-0582-4a83-ac7f-919246a12001
https://www.globenewswire.com/NewsRoom/AttachmentNg/c89bdd9b-61a7-4ec3-ab15-37b6c10dc003

![]()
Figure 1: Wildcat & Mountain View Production Profile
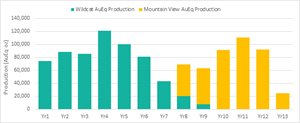
Production (AuEq oz)
Figure 2: Wildcat & Mountain View Cash Flow Profile
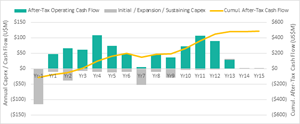
Annual Capex / Cash Flow (U$M)
2023 GlobeNewswire, Inc., source


