“We delivered a record performance in the second quarter on multiple fronts. Operationally, we produced a record 136,000 ounces, exceeding quarterly guidance, at costs consistent with annual guidance. This was driven by another excellent quarter from La
“The strong production growth and margin expansion led to a record quarter financially across a number of metrics including record revenue and operating cash flow. We also generated record free cash flow of
Second Quarter 2023
- Produced a record 136,000 ounces of gold, exceeding quarterly guidance of 120,000 to 130,000 ounces. This represented a 31% increase from the second quarter of 2022 and 6% increase from the first quarter of 2023 driven by strong production growth from the
Mulatos District . The Company remains well positioned to achieve 2023 annual guidance - Record free cash flow1 of
$61.6 million reflecting strong operating results and margin expansion, as well as benefiting from the collection of sales tax receivables inCanada that had been temporarily delayed in the first quarter. The Company expects to continue generating strong free cash flow over the next several years while funding the Phase 3+ Expansion at Island Gold - Generated record cash flow from operating activities of
$141.8 million ($138.3 million , or$0.35 per share, before changes in working capital1) The Mulatos District produced 60,300 ounces, a 19% increase from the first quarter of 2023, and the highest level in 10 years, reflecting another solid quarter from LaYaqui Grande . The strong performance drove a 28% increase in mine-site free cash flow from the first quarter of 2023 to$47.0 million , bringing the first half total to$83.8 million Young -Davidson continues to perform well, producing 45,200 ounces, consistent with the first quarter of 2023, and generating record mine-site free cash flow1 of$35.4 million . Through the first half of the year,Young -Davidson generated$51.7 million of mine-site free cash flow and remains on track to generate over$100 million for the third consecutive year- Island Gold produced 30,500 ounces and continues to self-finance the majority of the Phase 3+ Expansion. The Expansion is progressing well with the construction of the hoist house largely complete, the headframe well underway, and shaft sinking on track to start in the fourth quarter of 2023
- Sold 131,952 ounces of gold at an average realized price of
$1,978 per ounce, for record quarterly revenues of$261.0 million . The average realized gold price was$2 per ounce above the London PM fix for the quarter - Total cash costs1 of
$847 per ounce were consistent with annual guidance, and all-in sustaining costs ("AISC"1) of$1,112 per ounce were below the low end of guidance and down 5% from the first quarter of 2023, reflecting low-cost production growth from LaYaqui Grande and lower sustaining capital - Realized adjusted net earnings1 of
$59.3 million , or$0.15 per share. Adjusted net earnings includes adjustments for unrealized foreign exchange gains recorded within both deferred taxes and foreign exchange of$13.4 million , and other gains totaling$2.4 million . Reported net earnings were$75.1 million , or$0.19 per share - Paid a quarterly dividend of
$9.9 million , or$0.025 per share (annualized rate of$0.10 per share) - Cash and cash equivalents increased to
$188.6 million , up from$133.8 million at the end of the first quarter, reflecting strong free cash flow. The Company remains debt free - Completed the acquisition of
Manitou Gold onMay 23, 2023 , adding significant exploration potential across the Michipicoten Greenstone Belt by more than tripling the regional land package adjacent to and along strike from Island Gold - Provided an exploration update at
Mulatos , further extending high-grade mineralization beyond Mineral Reserves and Resources atPuerto Del Aire ("PDA") and intersected a wide interval of significant gold mineralization at the Capulin regional target - Provided an exploration update at Island Gold, extending high-grade mineralization across the deposit including within recently defined hanging wall and footwall zones in proximity to existing underground infrastructure
- Completed an Impact Benefit Agreement and signing ceremony with
Marcel Colomb First Nation for theLynn Lake project inManitoba, Canada - Publication of Alamos’ inaugural Climate Change Report, outlining corporate governance around climate-related risks and opportunities
(1) Refer to the “Non-GAAP Measures and Additional GAAP Measures” disclosure at the end of this press release and associated MD&A for a description and calculation of these measures.
Highlight Summary
| Three Months Ended | Six Months Ended | |||||||||||
| 2023 | 2022 | 2023 | 2022 | |||||||||
| Financial Results (in millions) | ||||||||||||
| Operating revenues | ||||||||||||
| Cost of sales (1) | ||||||||||||
| Earnings from operations | ||||||||||||
| Earnings before income taxes | ||||||||||||
| Net earnings (loss) | ( | ) | ||||||||||
| Adjusted net earnings (2) | ||||||||||||
| Earnings before interest, depreciation and amortization (2) | ||||||||||||
| Cash provided by operations before working capital and taxes paid(2) | ||||||||||||
| Cash provided by operating activities | ||||||||||||
| Capital expenditures (sustaining) (2) | ||||||||||||
| Capital expenditures (growth) (2) (3) | ||||||||||||
| Capital expenditures (capitalized exploration) (4) | ||||||||||||
| Free cash flow (2) | ( | ) | ||||||||||
| Operating Results | ||||||||||||
| Gold production (ounces) | 136,000 | 103,900 | 264,400 | 202,800 | ||||||||
| Gold sales (ounces) | 131,952 | 102,164 | 264,620 | 200,630 | ||||||||
| Per Ounce Data | ||||||||||||
| Average realized gold price | ||||||||||||
| Average spot gold price (London PM Fix) | ||||||||||||
| Cost of sales per ounce of gold sold (includes amortization) (1) | ||||||||||||
| Total cash costs per ounce of gold sold (2) | ||||||||||||
| All-in sustaining costs per ounce of gold sold (2) | ||||||||||||
| Share Data | ||||||||||||
| Earnings (loss) per share, basic and diluted | ( | ) | ||||||||||
| Adjusted earnings per share, basic and diluted(2) | ||||||||||||
| Weighted average common shares outstanding (basic) (000’s) | 395,346 | 391,761 | 394,657 | 391,837 | ||||||||
| Financial Position (in millions) | ||||||||||||
| Cash and cash equivalents(5) | ||||||||||||
(1) Cost of sales includes mining and processing costs, royalties, and amortization expense.
(2) Refer to the “Non-GAAP Measures and Additional GAAP Measures” disclosure at the end of this press release and associated MD&A for a description and calculation of these measures.
(3) Includes growth capital from operating sites.
(4) Includes capitalized exploration at Island Gold,
(5) Comparative cash and cash equivalents balance as at
| Three Months Ended | Six Months Ended | |||||||||||
| 2023 | 2022 | 2023 | 2022 | |||||||||
| Gold production (ounces) | ||||||||||||
| 45,200 | 46,400 | 90,200 | 98,300 | |||||||||
| Island Gold | 30,500 | 37,300 | 63,400 | 61,800 | ||||||||
| 60,300 | 20,200 | 110,800 | 42,700 | |||||||||
| Gold sales (ounces) | ||||||||||||
| 43,570 | 46,662 | 89,246 | 98,187 | |||||||||
| Island Gold | 28,183 | 36,797 | 61,910 | 60,165 | ||||||||
| 60,199 | 18,705 | 113,464 | 42,278 | |||||||||
| Cost of sales (in millions)(1) | ||||||||||||
| Island Gold | ||||||||||||
| Cost of sales per ounce of gold sold (includes amortization) (1) | ||||||||||||
| Island Gold | ||||||||||||
| Total cash costs per ounce of gold sold (2) | ||||||||||||
| Island Gold | ||||||||||||
| Mine-site all-in sustaining costs per ounce of gold sold (2),(3) | ||||||||||||
| Island Gold | ||||||||||||
| Capital expenditures (sustaining, growth and capitalized exploration) (in millions)(2) | ||||||||||||
| Island Gold (5) | ||||||||||||
| Other | ||||||||||||
(1) Cost of sales includes mining and processing costs, royalties, and amortization expense.
(2) Refer to the “Non-GAAP Measures and Additional GAAP Measures” disclosure at the end of this press release and associated MD&A for a description and calculation of these measures.
(3) For the purposes of calculating mine-site all-in sustaining costs, the Company does not include an allocation of corporate and administrative and share based compensation expenses.
(4) Includes capitalized exploration at
(5) Includes capitalized exploration at Island Gold of
(6) Includes capitalized exploration at
(7)
Environment, Social and Governance Summary Performance
Health and Safety
- Total recordable injury frequency rate1 ("TRIFR") of 1.23 in the second quarter, down from 1.56 in the first quarter of 2023
- Lost time injury frequency rate1 ("LTIFR") of 0.09 in the second quarter, up from 0.00 in the first quarter of 2023
- Year-to-date TRIFR of 1.40 and LTIFR of 0.05
During the second quarter of 2023, the TRIFR decreased with 13 recordable injuries, four less than the prior quarter. One lost time injury was recorded in the quarter involving a hand injury to an exploration drilling contractor at
Environment
- Zero significant environmental incidents and zero reportable spills in the second quarter and year-to-date
- Detailed design works completed for the reclamation of the Cerro Pelon,
El Victor andSan Carlos open pits within theMulatos District - Completed site visits with Alamos’
Independent Tailings Review Board toYoung -Davidson and Island Gold
The Company is committed to preserving the long-term health and viability of the natural environment that surrounds its operations and projects. This includes investing in new initiatives to reduce our environmental footprint with the goal of minimizing the environmental impacts of our activities and offsetting any impacts that cannot be fully mitigated or rehabilitated.
Community
- Completed an Impact Benefit Agreement and signing ceremony with
Marcel Colomb First Nation for theLynn Lake project, with the goal of providing long term socio-economic benefits to the community and collaboration on economic development, jobs, training and environmental stewardship of the project - Held a ceremonial signing to celebrate the Definitive Agreement announced earlier in the year between Alamos and
Batchewana First Nation for the Island Gold mine
In addition, ongoing donations, medical support and infrastructure investments were provided to local communities, including:
- Eye health, dental health, and sexual education campaigns with residents of Matarachi
- Various contributions within the Temiskaming and Algoma districts of
Ontario , including donations to theTemiskaming Hospital Foundation , rejuvenation of theElk Lake playground, funds to support theMatachewan community garden, and sponsorship of various local events - Island Gold hosted its second 'Mining Showcase' event for high school students at École
St. Joseph in Wawa - Annual clean-up in
Dubreuilville with participants from Island Gold, the township and local students
The Company believes that excellence in sustainability provides a net benefit to all stakeholders. The Company continues to engage with local communities to understand local challenges and priorities. Ongoing investments in local infrastructure, health care, education, cultural and community programs remain a focus of the Company.
Governance and Disclosure
- Publication of Alamos’ inaugural Climate Change Report, outlining corporate governance around climate-related risks and opportunities; the Company’s processes to identify, assess and manage climate-related risks; alignment to
Task Force on Climate-related Financial Disclosure recommendations; and further details on Alamos’ 30% absolute greenhouse gas emission reduction target by 2030 - Publication of Alamos’ 2022 Report on conformance to the World Gold Council’s Responsible Gold Mining Principles and independent assurance report
- Publication of the annual report outlining payments to governments under Canada’s Extractive Sector Transparency Measures Act
The Company maintains the highest standards of corporate governance to ensure that corporate decision-making reflects its values, including the Company’s commitment to sustainable development. During the quarter, the Company continued to advance its implementation of the Responsible Gold Mining Principles, developed by the
(1) Frequency rate is calculated as incidents per 200,000 hours worked.
Outlook and Strategy
| 2023 Guidance | |||||||||
| Island Gold | Total | ||||||||
| Gold production (000’s ounces) | 185 - 200 | 120 - 135 | 175 - 185 | 480 - 520 | |||||
| Cost of sales, including amortization (in millions)(3) | $625 | ||||||||
| Cost of sales, including amortization ($ per ounce)(3) | $1,250 | ||||||||
| Total cash costs ($ per ounce)(1) | — | ||||||||
| All-in sustaining costs ($ per ounce)(1) | |||||||||
| Mine-site all-in sustaining costs ($ per ounce)(1)(2) | — | ||||||||
| Capital expenditures (in millions) | |||||||||
| Sustaining capital(1) | — | ||||||||
| Growth capital(1) | |||||||||
| $12 | |||||||||
| Capitalized exploration(1) | $25 | ||||||||
| Total capital expenditures and capitalized exploration(1) | $17 | ||||||||
(1) Refer to the "Non-GAAP Measures and Additional GAAP" disclosure at the end of this press release and associated MD&A for a description of these measures.
(2) For the purposes of calculating mine-site all-in sustaining costs at individual mine sites, the Company does not include an allocation of corporate and administrative and share based compensation expenses to the mine sites.
(3) Cost of sales includes mining and processing costs, royalties, and amortization expense, and is calculated based on the mid-point of total cash cost guidance.
The Company’s objective is to operate a sustainable business model that can support growing returns to all stakeholders over the long-term, through growing production, expanding margins, and increasing profitability. This includes a balanced approach to capital allocation focused on generating strong ongoing free cash flow while re-investing in high-return internal growth opportunities and supporting higher returns to shareholders.
With a record second quarter performance, the Company continues to successfully execute on this strategy on all fronts. Production increased to a new record of 136,000 ounces, exceeding second quarter guidance, while AISC decreased below the low end of full year guidance. This was driven by another strong quarter from the
Financially it was a record quarter on a number of fronts reflecting the strong operational performance and higher gold prices. The Company generated record quarterly revenues, cash flow from operations and free cash flow. The significant increase in free cash flow to
After achieving a significant permitting milestone earlier this year at the
The Company continues to have broad based success adding value through its exploration programs. This includes extending high-grade mineralization beyond Mineral Reserves and Resources at Island Gold and PDA, demonstrating ongoing growth potential at both assets. This will be incorporated into a new development plan for PDA to be completed in the fourth quarter of 2023 which is expected to outline a significant mine life extension at the
As outlined in the three-year production and operating guidance provided in
The Company is well positioned to achieve 2023 guidance with production through the first half of the year totaling 264,400 ounces and total cash costs and AISC both in-line with guidance. In the third quarter, production is expected to be between 120,000 and 130,000 ounces, at AISC near the upper end of the annual guidance range. Third quarter guidance reflects lower planned production from the
Island Gold produced 63,400 ounces in the first half of the year, and with higher mining and processing rates expected in the second half of the year, the operation is on track to meet full year guidance. As outlined in the Phase 3+ Expansion study released in
Combined gold production from the
Capital spending, including capitalized exploration, totaled
The global exploration budget for 2023 is consistent with spending in 2022.
The Company's liquidity position continues to strengthen with cash and cash equivalents increasing to
Second Quarter 2023 results
Young-Davidson Financial and Operational Review
| Three Months Ended | Six Months Ended | |||||||||||
| 2023 | 2022 | 2023 | 2022 | |||||||||
| Gold production (ounces) | 45,200 | 46,400 | 90,200 | 98,300 | ||||||||
| Gold sales (ounces) | 43,570 | 46,662 | 89,246 | 98,187 | ||||||||
| Financial Review (in millions) | ||||||||||||
| Operating Revenues | ||||||||||||
| Cost of sales (1) | ||||||||||||
| Earnings from operations | ||||||||||||
| Cash provided by operating activities | ||||||||||||
| Capital expenditures (sustaining) (2) | ||||||||||||
| Capital expenditures (growth) (2) | ||||||||||||
| Capital expenditures (capitalized exploration) (2) | ||||||||||||
| Mine-site free cash flow (2) | ||||||||||||
| Cost of sales, including amortization per ounce of gold sold (1) | ||||||||||||
| Total cash costs per ounce of gold sold (2) | ||||||||||||
| Mine-site all-in sustaining costs per ounce of gold sold (2),(3) | ||||||||||||
| Underground Operations | ||||||||||||
| Tonnes of ore mined | 736,078 | 742,516 | 1,457,005 | 1,478,820 | ||||||||
| Tonnes of ore mined per day | 8,089 | 8,160 | 8,050 | 8,170 | ||||||||
| Average grade of gold (4) | 2.14 | 2.24 | 2.18 | 2.30 | ||||||||
| Metres developed | 2,238 | 3,097 | 4,933 | 6,344 | ||||||||
| Mill Operations | ||||||||||||
| Tonnes of ore processed | 696,718 | 705,014 | 1,398,672 | 1,442,742 | ||||||||
| Tonnes of ore processed per day | 7,656 | 7,747 | 7,727 | 7,971 | ||||||||
| Average grade of gold (4) | 2.13 | 2.25 | 2.18 | 2.32 | ||||||||
| Contained ounces milled | 47,774 | 50,975 | 97,987 | 107,445 | ||||||||
| Average recovery rate | 91 | % | 91 | % | 91 | % | 91 | % | ||||
(1) Cost of sales includes mining and processing costs, royalties and amortization.
(2) Refer to the “Non-GAAP Measures and Additional GAAP Measures” disclosure at the end of this press release and associated MD&A for a description and calculation of these measures.
(3) For the purposes of calculating mine-site all-in sustaining costs, the Company does not include an allocation of corporate and administrative and share based compensation expenses.
(4) Grams per tonne of gold ("g/t Au").
Operational review
Underground mining rates exceeded full year guidance, averaging 8,089 tpd in the second quarter. Grades mined averaged 2.14 g/t Au in the quarter, similar to the first quarter of 2023 and consistent with the low end of annual guidance. As previously guided, grades mined are expected to increase through the second half of the year.
Mill throughput averaged 7,656 tpd in the second quarter with grades processed averaging 2.13 g/t Au. Tonnes milled were lower than mined reflecting a scheduled liner change as well as unplanned downtime due to weather related power outages in the region. The mill has returned to targeted operating rates in July and is expected to average 8,000 tpd through the rest of the year. Mill recoveries averaged 91% in the quarter, in line with guidance and the prior year period.
Financial Review
Second quarter revenues of
Cost of sales of
Total cash costs were
Capital expenditures in the quarter included
Island Gold Financial and Operational Review
| Three Months Ended | Six Months Ended | |||||||||||
| 2023 | 2022 | 2023 | 2022 | |||||||||
| Gold production (ounces) | 30,500 | 37,300 | 63,400 | 61,800 | ||||||||
| Gold sales (ounces) | 28,183 | 36,797 | 61,910 | 60,165 | ||||||||
| Financial Review (in millions) | ||||||||||||
| Operating Revenues | ||||||||||||
| Cost of sales (1) | ||||||||||||
| Earnings from operations | ||||||||||||
| Cash provided by operating activities | ||||||||||||
| Capital expenditures (sustaining) (2) | ||||||||||||
| Capital expenditures (growth) (2) | ||||||||||||
| Capital expenditures (capitalized exploration) (2) | ||||||||||||
| Mine-site free cash flow (2) | ( | ) | ( | ) | ||||||||
| Cost of sales, including amortization per ounce of gold sold (1) | ||||||||||||
| Total cash costs per ounce of gold sold (2) | ||||||||||||
| Mine-site all-in sustaining costs per ounce of gold sold (2),(3) | ||||||||||||
| Underground Operations | ||||||||||||
| Tonnes of ore mined | 100,568 | 112,203 | 208,964 | 215,192 | ||||||||
| Tonnes of ore mined per day ("tpd") | 1,105 | 1,233 | 1,154 | 1,189 | ||||||||
| Average grade of gold (4) | 9.23 | 10.02 | 9.40 | 9.22 | ||||||||
| Metres developed | 2,134 | 1,902 | 4,237 | 3,341 | ||||||||
| Mill Operations | ||||||||||||
| Tonnes of ore processed | 102,000 | 114,448 | 209,508 | 215,097 | ||||||||
| Tonnes of ore processed per day | 1,121 | 1,258 | 1,158 | 1,118 | ||||||||
| Average grade of gold (4) | 9.51 | 10.09 | 9.54 | 9.18 | ||||||||
| Contained ounces milled | 31,180 | 37,132 | 64,262 | 63,459 | ||||||||
| Average recovery rate | 97 | % | 96 | % | 97 | % | 96 | % | ||||
(1) Cost of sales includes mining and processing costs, royalties, and amortization.
(2) Refer to the “Non-GAAP Measures and Additional GAAP Measures” disclosure at the end of this press release and associated MD&A for a description and calculation of these measures.
(3) For the purposes of calculating mine-site all-in sustaining costs, the Company does not include an allocation of corporate and administrative and share based compensation expenses.
(4) Grams per tonne of gold ("g/t Au").
Operational review
Island Gold produced 30,500 ounces in the second quarter of 2023, an 18% decrease from the prior year period reflecting lower tonnes and grades processed. For the first six months of 2023, Island Gold produced 63,400 ounces, a 3% increase from the prior year period driven by higher grades mined and processed. With stronger mining and milling rates expected in the second half of the year, the operation remains on track to meet full year production guidance.
Underground mining rates averaged 1,105 tpd in the second quarter, lower than both annual guidance and the prior year period reflecting unplanned downtime due to smoke from wildfires in
Mill throughput averaged 1,121 tpd, lower than annual guidance and the prior year period, due to lower mining rates, downtime for maintenance on the fine ore bin, and the above noted weather related power outages. Milling rates have returned to guided rates through July and are expected to average 1,200 tpd through the second half of the year. Mill recoveries averaged 97% in the quarter, slightly above the prior year period.
Financial Review
Island Gold generated revenues of
Cost of sales of
Total cash costs of
Total capital expenditures were
Mine-site free cash flow was negative
Mulatos District Financial and Operational Review
| Three Months Ended | Six Months Ended | |||||||||||
| 2023 | 2022 | 2023 | 2022 | |||||||||
| Gold production (ounces) | 60,300 | 20,200 | 110,800 | 42,700 | ||||||||
| Gold sales (ounces) | 60,199 | 18,705 | 113,464 | 42,278 | ||||||||
| Financial Review (in millions) | ||||||||||||
| Operating Revenues | ||||||||||||
| Cost of sales (1) | ||||||||||||
| Earnings (loss) from operations | ( | ) | ( | ) | ||||||||
| Cash provided (used) by operating activities | ( | ) | ( | ) | ||||||||
| Capital expenditures (sustaining) (2) | ||||||||||||
| Capital expenditures (growth) (2) | ||||||||||||
| Capital expenditures (capitalized exploration) (2) | ||||||||||||
| Mine-site free cash flow (2) | ( | ) | ( | ) | ||||||||
| Cost of sales, including amortization per ounce of gold sold (1) | ||||||||||||
| Total cash costs per ounce of gold sold (2) | ||||||||||||
| Mine site all-in sustaining costs per ounce of gold sold (2),(3) | ||||||||||||
| Open Pit Operations | ||||||||||||
| Tonnes of ore mined - open pit (4) | 996,117 | 343,884 | 2,029,060 | 496,818 | ||||||||
| Total waste mined - open pit (6) | 5,603,937 | 6,260,883 | 11,434,752 | 12,142,114 | ||||||||
| Total tonnes mined - open pit | 6,600,053 | 6,604,767 | 13,463,812 | 12,638,932 | ||||||||
| Waste-to-ore ratio (operating) | 5.00 | 4.00 | 5.00 | 4.00 | ||||||||
| Crushing and Heap Leach Operations | ||||||||||||
| Tonnes of ore stacked | 1,013,932 | 333,166 | 2,033,567 | 333,166 | ||||||||
| Average grade of gold processed (5) | 1.52 | 1.57 | 1.54 | 1.57 | ||||||||
| Contained ounces stacked | 49,552 | 16,777 | 100,474 | 16,777 | ||||||||
| Average recovery rate | 87 | % | 30 | % | 81 | % | 30 | % | ||||
| Ore crushed per day (tonnes) | 11,000 | 5,500 | 11,200 | 5,500 | ||||||||
| Open Pit Operations | ||||||||||||
| Tonnes of ore mined - open pit (4) | 1,167,727 | 1,227,625 | 2,169,512 | 1,841,438 | ||||||||
| Total waste mined - open pit (6) | 566,761 | 1,691,474 | 1,178,516 | 3,664,026 | ||||||||
| Total tonnes mined - open pit | 1,734,488 | 2,919,099 | 3,348,027 | 5,505,464 | ||||||||
| Waste-to-ore ratio (operating) | 0.49 | 1.38 | 0.54 | 1.45 | ||||||||
| Crushing and Heap Leach Operations | ||||||||||||
| Tonnes of ore stacked | 1,417,645 | 1,526,771 | 2,646,721 | 3,268,254 | ||||||||
| Average grade of gold processed (5) | 1.10 | 0.68 | 1.02 | 0.70 | ||||||||
| Contained ounces stacked | 49,911 | 33,197 | 86,452 | 74,049 | ||||||||
| Average recovery rate | 35 | % | 46 | % | 34 | % | 51 | % | ||||
| Ore crushed per day (tonnes) | 15,600 | 16,800 | 14,600 | 18,100 | ||||||||
(1) Cost of sales includes mining and processing costs, royalties, and amortization expense.
(2) Refer to the “Non-GAAP Measures and Additional GAAP Measures” disclosure at the end of this press release and associated MD&A for a description and calculation of these measures.
(3) For the purposes of calculating mine-site all-in sustaining costs, the Company does not include an allocation of corporate and administrative and share based compensation expenses.
(4) Includes ore stockpiled during the quarter.
(5) Grams per tonne of gold ("g/t Au").
(6) Total waste mined includes operating waste and capitalized stripping.
Mulatos District Operational Review
La Yaqui Grande Operational Review
La
Mulatos Operational Review
Financial Review (
Revenues of
Cost of sales of
Total cash costs for the
Capital expenditures totaled
Second Quarter 2023 Development Activities
Island Gold (
Phase 3+ Expansion
On
The Phase 3+ Expansion to 2,400 tpd from the current rate of 1,200 tpd will involve various infrastructure investments. These include the installation of a shaft, paste plant, expansion of the mill as well as accelerated development to support the higher mining rates. Following the completion of the expansion in 2026, the operation will transition from trucking ore and waste up the ramp to skipping ore and waste to surface through the new shaft infrastructure, driving production higher and costs significantly lower.
Construction continued to advance through the second quarter of 2023, with the focus on shaft site surface infrastructure, including the hoist installation and headframe erection. Shaft surface construction will continue through the remainder of the year, with shaft sinking commencing in the fourth quarter. Further details on progress to the end of the second quarter are summarized below:
- Completion of the 44kV powerline from the existing
Island Gold Mine substation to the shaft area substation location - Completed major mechanical components installation for Service & Production Hoists
- Completed over 90% of major buried services required to start shaft sinking
- Constructed crane runway pad and commenced erection of the headframe structural steel
- Lowered the
Galloway into the shaft pre-sink to support sinking - Assembly and installation of the pre-fabricated E-house building modules
Paste plant detailed engineering was 50% complete; issuance of long lead time equipment procurement packages ongoing- Mill expansion basic engineering was 50% complete, with overall engineering being 20% complete; issuance of long lead time equipment procurement packages ongoing
- Lateral development to support higher mining rates with the Phase 3+ Expansion remains ongoing
During the second quarter of 2023, the Company spent
| (in US$M) Growth capital (including indirects and contingency) | P3+ 2400 Study1 | Spent to date | Committed to date | % of Spent & Committed | |||||||
| 229 | 97 | 66 | 71 | % | |||||||
| Mill Expansion | 76 | 2 | 1 | 4 | % | ||||||
| Paste Plant | 52 | 1 | 1 | 4 | % | ||||||
| Power Upgrade | 24 | 2 | 3 | 21 | % | ||||||
| 16 | — | — | — | ||||||||
| General Indirect Costs | 64 | 23 | 3 | 41 | % | ||||||
| Contingency | 55 | — | |||||||||
| 39 | % | ||||||||||
| Underground Equipment & Infrastructure | 79 | 17 | — | 22 | % | ||||||
| 162 | 53 | — | 33 | % | |||||||
| 36 | % | ||||||||||
(1) Phase 3+ 2400 Study is as of
Growth capital spending at Island Gold on the Phase 3+ Expansion is expected to be between
Shaft site area -
Hoist house interior and drums -
The Company released a positive Feasibility Study on the
In March, the Company achieved a significant permitting milestone for the
As part of the Company's balanced approach to growth and capital allocation, no significant capital is expected to be spent on the development of
Development spending (excluding exploration) was
Kirazlı (Çanakkale, Türkiye)
On
On
Bilateral investment treaties are agreements between countries to assist with the protection of investments. The Treaty establishes legal protections for investment between Türkiye and
The Company incurred
Second Quarter 2023 Exploration Activities
Island Gold (
A total of
The underground exploration drilling program has been expanded from 27,500 metres ("m") in 2022 to 45,000 m in 2023. The program is focused on defining new Mineral Reserves and Resources in proximity to existing production horizons and infrastructure including along strike, and in the hanging-wall and footwall. These potential high-grade Mineral Reserve and Resource additions would be low cost to develop and could be incorporated into the mine plan and mined within the next several years, further increasing the value of the operation. To support the underground exploration drilling program, 444 m of underground exploration drift development is planned to extend drill platforms on the 490, 790, 945, and 980-levels. In addition to the exploration budget, 36,000 m of underground delineation drilling has been planned and included in sustaining capital for Island Gold.
A regional exploration program including 7,500 m of drilling is also budgeted in 2023. The focus will be on evaluating and advancing exploration targets outside the Island Gold Deposit on the 55,300 ha Island Gold property. A total of 3,630 m of surface regional drilling in 26 holes was completed in the second quarter. This drilling has focused on the Pine-Breccia target where visible gold has been intersected with assays pending (2,174 m in 22 holes), and at two early-stage targets (1,456 m in 4 holes).
A total of 16,943 m of underground exploration drilling was also completed in the second quarter in 66 holes. The objective of the underground drilling is to identify new Mineral Resources close to existing Mineral Resource or Reserve blocks. In addition to underground exploration drilling, a total of 4,408 m of underground delineation drilling was completed in 22 holes, focused on infill drilling to convert Mineral Resources to Mineral Reserves. Through the first half of 2023, 95 holes totaling 23,835 m have been completed as part of the underground exploration program, and 45 holes totaling 7,827 m as part of the underground delineation drilling program. A total of 77 m of underground exploration drift development was also completed during the second quarter.
As announced in the
- Island West: high-grade mineralization extended outside of Mineral Reserves and Resources within the main C-Zone. The C and E1E-Zones are the main structures which host the majority of currently defined Mineral Reserves and Resources at Island Gold.
- 146.33 g/t Au (37.19 g/t cut) over 2.20 m (580-473-22); and
- 38.92 g/t Au (38.92 g/t cut) over 2.10 m (790-479-16).
- Island West Hanging Wall Zones: high-grade gold mineralization intersected within sub-parallel zones in the hanging wall, and within a newly defined perpendicular structure, the “NS1” Zone. Multiple sub-parallel and perpendicular hanging wall zones have been defined over the past year in proximity of existing underground infrastructure and represent a significant opportunity to add near mine Mineral Reserves and Resources.
NS1 Zone - 89.31 g/t Au (7.73 g/t cut) over 2.40 m (770-466-03);
- 25.57 g/t Au (5.68 g/t cut) over 2.50 m (770-466-07);
- 42.27 g/t Au (7.43 g/t cut) over 2.30 m (580-473-26);
- 16.06 g/t Au (6.95 g/t cut) over 2.80 m (770-466-02); and
- 14.50 g/t Au (10.08 g/t cut) over 3.10 m (580-473-25).
G1 Zone - 60.03 g/t Au (25.70 g/t cut) over 2.50 m (790-479-13); and
- 11.13 g/t Au (6.82 g/t cut) over 2.20 m (850-471-01B).
- Island West Footwall Zones: high-grade gold mineralization intersected within newly defined sub-parallel structure the “DN” zone.
- 22.34 g/t Au (22.34 g/t cut) over 2.90 m (790-479-04).
- Island East: high-grade mineralization extended outside of Mineral Reserves and Resources in the main E1E-Zone.
- 104.48 g/t Au (50.76 g/t cut) over 3.10 m (840-608-49);
- 40.54 g/t Au (33.33 g/t cut) over 2.50 m (840-608-43); and
- 11.93 g/t Au (11.93 g/t cut) over 4.20 m (840-632-17).
- Island East Footwall Zones: high-grade gold mineralization intersected within sub-parallel zones in the footwall (NTH2, NTH3) in proximity to existing underground infrastructure.
NTH2 Zone - 44.48 g/t Au (9.71 g/t cut) over 3.10 m (620-629-03); and
- 17.91 g/t Au (5.34 g/t cut) over 2.10 m (620-629-01).
NTH3 Zone - 12.34 g/t Au (7.65 g/t cut) over 3.30 m (840-554-44);
- 16.86 g/t Au (11.40 g/t cut) over 2.30 m (840-554-60);
- 13.21 g/t Au (13.21 g/t cut) over 2.70 m (840-554-04); and
- 11.02 g/t Au (7.29 g/t cut) over 2.30 m (840-566-08).
Note: All reported drill widths are true width of the mineralized zones, unless otherwise stated. Drillhole composite intervals reported as “cut” may include higher grade samples which have been cut to: C-zone @ 225 g/t Au;
Total exploration expenditures during the second quarter were
A total of
The focus of the underground exploration drilling program will be to expand Mineral Reserves and Resources in five target areas in proximity to existing underground infrastructure. This includes targeting additional gold mineralization within the syenite which hosts the majority of Mineral Reserves and Resources, as well as within the hanging wall and footwall of the deposit where higher grades have been previously intersected.
During the second quarter of 2023, two underground exploration drills completed 6,065 m in 14 holes from the 9220 West exploration drift. Drilling is targeting syenite-hosted mineralization as well as continuing to test mineralization in the footwall sediments and in the hanging wall mafic-ultramafic stratigraphy. During the first half of 2023, a total of 11,696 m was completed in 27 holes.
In addition, 5,000 m of surface drilling is planned to test near-surface targets across the 5,900 ha
A total of 87 m of underground exploration drift development was completed in the second quarter to extend drill platforms on the 9620 and 9220 levels.
Total exploration expenditures during the second quarter were
The Company has a large exploration package covering 28,972 ha with the majority of past exploration efforts focused around the
During the second quarter of 2023, exploration activities continued at PDA and the near-mine area with 17,581 m of drilling completed in 59 holes. Exploration drilling at PDA has been extremely successful with Mineral Reserves increasing 70% in 2022 to 728,000 ounces (4.7mt grading 4.84 g/t Au) with grades also increasing 4% as of the end of 2022. Ongoing exploration results will be incorporated into an updated development plan which is expected to be completed in the fourth quarter of 2023.
The regional program included 8,741 m of drilling completed in 33 drill holes. At the Capulin target, 4,293 m in nine drill holes was completed in the second quarter. Drilling also continued at Carricito with 748 m completed in seven holes. Drilling at the Cerro Pelon West target began in the second quarter with 2,431 m completed in ten drill holes.
As announced in the
- High-grade gold mineralization further extended beyond Mineral Reserves and Resources at PDA, supporting the potential for ongoing growth of the deposit which remains open in multiple directions. This follows a 71% increase in combined Mineral Reserves and Resources in 2022 to total 1.0 million ounces. All reported composite widths are estimated true width of the mineralized zones.
- 20.95 g/t Au (11.14 g/t cut) over 14.15 m (23MUL117);
- 8.33 g/t Au (8.33 g/t cut) over 18.00 m (23MUL119);
- 14.81 g/t Au (12.34 g/t cut) over 9.10 m (23MUL112);
- 16.19 g/t Au (7.63 g/t cut) over 7.75 m (23MUL108);
- 33.14 g/t Au (33.14 g/t cut) over 3.05 m, and 10.80 g/t Au (10.80 g/t cut) over 3.00 m (23MUL098); and
- 15.49 g/t Au (13.89 g/t cut) over 6.00 m (23MUL115).
Capulin Target
- Significant interval of oxide and sulphide gold mineralization intersected in a breccia along the Capulin Fault. Follow-up drilling is ongoing in this area to test the geometry and extent of the gold mineralization and the breccia unit.
- 2.01 g/t Au (2.01 g/t cut) over 82.45 m core length, including 4.81 g/t Au over 16.40 m and 5.38 g/t Au over 12.35 m (23REF012).
During the second quarter, the Company incurred
A total of
During the second quarter of 2023, 3,458 m of drilling was completed in 16 holes at the Gemmell, Gordon, Jim and Tulune targets. Year-to-date, 7,979 m of drilling has been completed in 29 holes. Geological mapping and sampling is underway as part of the 2023 summer field season to continue development of a pipeline of drill-ready regional exploration targets in the highly prospective
Exploration spending totaled
Review of Second Quarter Financial Results
During the second quarter of 2023, the Company sold 131,952 ounces of gold for record revenues of
The average realized gold price in the second quarter was
Cost of sales (which includes mining and processing costs, royalties, and amortization expense) were
Mining and processing costs were
Total cash costs of
Royalty expense was
Amortization of
The Company recognized earnings from operations of
The Company reported net earnings of
(1) Refer to the “Non-GAAP Measures and Additional GAAP Measures” disclosure at the end of this press release and associated MD&A for a description and calculation of these measures.
Associated Documents
This press release should be read in conjunction with the Company’s interim consolidated financial statements for the three-month period ended
Reminder of Second Quarter 2023 Results Conference Call
The Company's senior management will host a conference call on
| (416) 340-2217 | |
| Toll free ( | (800) 806-5484 |
| Participant passcode: | 1342473# |
| Webcast: | www.alamosgold.com |
A playback will be available until
Qualified Persons
About Alamos
Alamos is a Canadian-based intermediate gold producer with diversified production from three operating mines in
FOR FURTHER INFORMATION, PLEASE CONTACT:
Senior Vice-President, Investor Relations
(416) 368-9932 x 5439
All amounts are in
The TSX and NYSE have not reviewed and do not accept responsibility for the adequacy or accuracy of this release.
Cautionary Note Regarding Forward-Looking Statements
This press release contains or incorporates by reference “forward-looking statements” and “forward-looking information” as defined under applicable Canadian and
Such statements include, but may not be limited to, guidance and expectations pertaining to: free cash flow, gold production, total cash costs, all-in sustaining costs, mine-site all-in sustaining costs, capital expenditures, total sustaining and growth capital, and capitalized exploration; achieving 2023 annual production and cost guidance; increases to production, value of operation and decreases to costs resulting from intended completion of the Phase 3+ Expansion at Island Gold; intended infrastructure investments in, method of funding for, and timing of the completion of, the Phase 3+ Expansion; the intended release of an updated Feasibility Study for the
Alamos cautions that forward-looking statements are necessarily based upon a number of factors and assumptions that, while considered reasonable by the Company at the time of making such statements, are inherently subject to significant business, economic, technical, legal, political and competitive uncertainties and contingencies. Known and unknown factors could cause actual results to differ materially from those projected in the forward-looking statements and undue reliance should not be placed on such statements and information.
Risk factors that may affect Alamos’ ability to achieve the expectations set forth in the forward-looking statements in this document include, but are not limited to: changes to current estimates of mineral reserves and resources; changes to production estimates (which assume accuracy of projected ore grade, mining rates, recovery timing and recovery rate estimates which may be impacted by unscheduled maintenance, weather issues, labour and contractor availability and other operating or technical difficulties); operations may be exposed to new diseases, epidemics and pandemics, including any ongoing effects and potential further effects of COVID-19; the impact of COVID-19 or any other new illness, epidemic or pandemic on the broader market and the trading price of the Company's shares; provincial and federal orders or mandates (including with respect to mining operations generally or auxiliary businesses or services required for the Company’s operations) in
Additional risk factors and details with respect to risk factors that may affect the Company’s ability to achieve the expectations set forth in the forward-looking statements contained in this press release are set out in the Company's latest 40-F/Annual Information Form under the heading “Risk Factors”, which is available on the SEDAR website at www.sedar.com or on EDGAR at www.sec.gov. The foregoing should be reviewed in conjunction with the information, risk factors and assumptions found in this press release.
The Company disclaims any intention or obligation to update or revise any forward-looking statements whether as a result of new information, future events or otherwise, except as required by applicable law.
Cautionary Note to U.S. Investors Concerning Measured, Indicated and Inferred Resources
Measured, Indicated and Inferred Resources: All resource and reserve estimates included in this press release or documents referenced in this press release have been prepared in accordance with Canadian National Instrument 43-101 - Standards of Disclosure for Mineral Projects ("NI 43-101") and the
Investors are cautioned that while the above terms are “substantially similar” to CIM Definitions, there are differences in the definitions under Regulation S-K 1300 and the CIM Standards. Accordingly, there is no assurance any mineral reserves or mineral resources that the Company may report as “proven mineral reserves”, “probable mineral reserves”, “measured mineral resources”, “indicated mineral resources” and “inferred mineral resources” under NI 43-101 would be the same had the Company prepared the mineral reserve or mineral resource estimates under the standards adopted under Regulation S-K 1300. U.S. investors are also cautioned that while the
International Financial Reporting Standards: The condensed interim consolidated financial statements of the Company have been prepared by management in accordance with International Financial Reporting Standard 34, Interim Financial Reporting, as issued by the
Non-GAAP Measures and Additional GAAP Measures
The Company has included certain non-GAAP financial measures to supplement its Consolidated Financial Statements, which are presented in accordance with IFRS, including the following:
- adjusted net earnings and adjusted earnings per share;
- cash flow from operating activities before changes in working capital and taxes received;
- company-wide free cash flow;
- total mine-site free cash flow;
- mine-site free cash flow;
- total cash cost per ounce of gold sold;
- AISC per ounce of gold sold;
- mine-site all-in sustaining cost ("Mine-site AISC") per ounce of gold sold;
- sustaining and non-sustaining capital expenditures; and
- earnings before interest, taxes, depreciation, and amortization ("EBITDA")
The Company believes that these measures, together with measures determined in accordance with IFRS, provide investors with an improved ability to evaluate the underlying performance of the Company. Non-GAAP financial measures do not have any standardized meaning prescribed under IFRS, and therefore they may not be comparable to similar measures employed by other companies. The data is intended to provide additional information and should not be considered in isolation or as a substitute for measures of performance prepared in accordance with IFRS. Management's determination of the components of non-GAAP and additional measures are evaluated on a periodic basis influenced by new items and transactions, a review of investor uses and new regulations as applicable. Any changes to the measures are dully noted and retrospectively applied as applicable.
Adjusted Net Earnings and Adjusted Earnings per Share
“Adjusted net earnings” and “adjusted earnings per share” are non-GAAP financial measures with no standard meaning under IFRS which exclude the following from net earnings:
- Foreign exchange gain (loss)
- Items included in other gain (loss)
- Certain non-reoccurring items
- Foreign exchange gain (loss) recorded in deferred tax expense
- The income and mining tax impact of items included in other gain (loss)
Net earnings have been adjusted, including the associated tax impact, for the group of costs in “other (gain) loss” on the consolidated statement of comprehensive income. Transactions within this grouping are: the fair value changes on non-hedged derivatives; the renunciation of flow-through exploration expenditures; loss on disposal of assets; severance costs related to Turkish Projects; and Turkish Projects holding costs and arbitration costs. The adjusted entries are also impacted for tax to the extent that the underlying entries are impacted for tax in the unadjusted net earnings (loss).
The Company uses adjusted net earnings for its own internal purposes. Management’s internal budgets and forecasts and public guidance do not reflect the items which have been excluded from the determination of adjusted net earnings. Consequently, the presentation of adjusted net earnings enables shareholders to better understand the underlying operating performance of the core mining business through the eyes of management. Management periodically evaluates the components of adjusted net earnings based on an internal assessment of performance measures that are useful for evaluating the operating performance of our business and a review of the non-GAAP measures used by mining industry analysts and other mining companies.
Adjusted net earnings is intended to provide additional information only and does not have any standardized meaning under IFRS and may not be comparable to similar measures presented by other companies. It should not be considered in isolation or as a substitute for measures of performance prepared in accordance with IFRS. The measure is not necessarily indicative of operating profit or cash flows from operations as determined under IFRS. The following table reconciles this non-GAAP measure to the most directly comparable IFRS measure.
| (in millions) | ||||||||||||
| Three Months Ended | Six Months Ended | |||||||||||
| 2023 | 2022 | 2023 | 2022 | |||||||||
| Net earnings (loss) | ( | ) | ||||||||||
| Adjustments: | ||||||||||||
| Inventory net realizable value adjustment, net of taxes | — | 14.7 | — | 14.7 | ||||||||
| Impairment charge, net of taxes | — | — | — | 26.7 | ||||||||
| Foreign exchange loss | (1.2 | ) | (0.4 | ) | (1.1 | ) | (0.4 | ) | ||||
| Other (gain) loss | (3.0 | ) | (5.4 | ) | (1.7 | ) | 2.0 | |||||
| Unrealized foreign exchange (gain) loss recorded in deferred tax expense | (12.2 | ) | 12.9 | (16.4 | ) | 7.1 | ||||||
| Other income tax and mining tax adjustments | 0.6 | 1.1 | 0.4 | (0.7 | ) | |||||||
| Adjusted net earnings | ||||||||||||
| Adjusted earnings per share - basic | ||||||||||||
Cash Flow from Operating Activities before Changes in Working Capital and Cash Taxes
“Cash flow from operating activities before changes in working capital and cash taxes” is a non-GAAP performance measure that could provide an indication of the Company’s ability to generate cash flows from operations, and is calculated by adding back the change in working capital and taxes received to “Cash provided by (used in) operating activities” as presented on the Company’s consolidated statements of cash flows. “Cash flow from operating activities before changes in working capital” is a non-GAAP financial measure with no standard meaning under IFRS.
The following table reconciles the non-GAAP measure to the consolidated statements of cash flows.
| (in millions) | ||||||||||||
| Three Months Ended | Six Months Ended | |||||||||||
| 2023 | 2022 | 2023 | 2022 | |||||||||
| Cash flow from operating activities | ||||||||||||
| Add: Changes in working capital and cash taxes | (3.5 | ) | 9.6 | 29.4 | 34.0 | |||||||
| Cash flow from operating activities before changes in working capital and cash taxes | $138.3 | $85.3 | $265.5 | $156.2 | ||||||||
Company-wide Free Cash Flow
“Company-wide free cash flow" is a non-GAAP performance measure calculated from the consolidated operating cash flow, less consolidated mineral property, plant and equipment expenditures. The Company believes this to be a useful indicator of our ability to operate without reliance on additional borrowing or usage of existing cash company-wide. Company-wide free cash flow is intended to provide additional information only and does not have any standardized meaning under IFRS and may not be comparable to similar measures of performance presented by other mining companies. Company-wide free cash flow should not be considered in isolation or as a substitute for measures of performance prepared in accordance with IFRS.
| (in millions) | ||||||||||||
| Three Months Ended | Six Months Ended | |||||||||||
| 2023 | 2022 | 2023 | 2022 | |||||||||
| Cash flow from operating activities | ||||||||||||
| Less: mineral property, plant and equipment expenditures | (80.2 | ) | (69.0 | ) | (164.0 | ) | (156.3 | ) | ||||
| Company-wide free cash flow | $61.6 | $6.7 | $72.1 | ($34.1 | ) | |||||||
Mine-site Free Cash Flow
"Mine-site free cash flow" is a non-GAAP financial performance measure calculated as cash flow from mine-site operating activities, less mineral property, plant and equipment expenditures. The Company believes this to be a useful indicator of our ability to operate without reliance on additional borrowing or usage of existing cash. Mine-site free cash flow is intended to provide additional information only and does not have any standardized meaning under IFRS and may not be comparable to similar measures of performance presented by other mining companies. Mine-site free cash flow should not be considered in isolation or as a substitute for measures of performance prepared in accordance with IFRS.
| Total Mine-Site Free Cash Flow | ||||||||||||
| Three Months Ended | Six Months Ended | |||||||||||
| 2023 | 2022 | 2023 | 2022 | |||||||||
| (in millions) | ||||||||||||
| Cash flow from operating activities | ||||||||||||
| Add: operating cash flow used by non-mine site activity | 10.8 | 9.0 | 29.2 | 24.4 | ||||||||
| Cash flow from operating mine-sites | $152.6 | $84.7 | $265.3 | $146.6 | ||||||||
| Mineral property, plant and equipment expenditure | ||||||||||||
| Less: capital expenditures from development projects, and corporate | (5.5 | ) | ( | ) | (9.2 | ) | (10.5 | ) | ||||
| Capital expenditure and capital advances from mine-sites | $74.7 | $63.7 | $154.8 | $145.8 | ||||||||
| Total mine-site free cash flow | $77.9 | $21.0 | $110.5 | $0.8 | ||||||||
| Young-Davidson Mine-Site Free Cash Flow | ||||||||||||
| Three Months Ended | Six Months Ended | |||||||||||
| 2023 | 2022 | 2023 | 2022 | |||||||||
| (in millions) | ||||||||||||
| Cash flow from operating activities | ||||||||||||
| Mineral property, plant and equipment expenditure | (13.5 | ) | (13.1 | ) | (30.9 | ) | (35.8 | ) | ||||
| Mine-site free cash flow | $35.4 | $30.8 | $51.7 | $54.0 | ||||||||
| Island Gold Mine-Site Free Cash Flow | ||||||||||||
| Three Months Ended | Six Months Ended | |||||||||||
| 2023 | 2022 | 2023 | 2022 | |||||||||
| (in millions) | ||||||||||||
| Cash flow from operating activities | ||||||||||||
| Mineral property, plant and equipment expenditure (1) | (54.7 | ) | (29.3 | ) | (111.7 | ) | (62.7 | ) | ||||
| Mine-site free cash flow | ($4.5 | ) | $20.2 | ($25.0 | ) | $14.2 | ||||||
(1) Includes capital advances of
| Mulatos District Free Cash Flow | ||||||||||||
| Three Months Ended | Six Months Ended | |||||||||||
| 2023 | 2022 | 2023 | 2022 | |||||||||
| (in millions) | ||||||||||||
| Cash flow from operating activities | ( | ) | ( | ) | ||||||||
| Mineral property, plant and equipment expenditure | (6.5 | ) | (21.3 | ) | (12.2 | ) | (47.3 | ) | ||||
| Mine-site free cash flow | $47.0 | ($30.0 | ) | $83.8 | ($67.4 | ) | ||||||
Total Cash Costs per ounce
Total cash costs per ounce is a non-GAAP term typically used by gold mining companies to assess the level of gross margin available to the Company by subtracting these costs from the unit price realized during the period. This non-GAAP term is also used to assess the ability of a mining company to generate cash flow from operations. Total cash costs per ounce includes mining and processing costs plus applicable royalties, and net of by-product revenue and net realizable value adjustments. This metric excludes COVID-19 costs incurred in the period. Total cash costs per ounce is exclusive of exploration costs.
Total cash costs per ounce is intended to provide additional information only and does not have any standardized meaning under IFRS and may not be comparable to similar measures presented by other mining companies. It should not be considered in isolation or as a substitute for measures of performance prepared in accordance with IFRS. The measure is not necessarily indicative of cash flow from operations under IFRS or operating costs presented under IFRS.
All-in Sustaining Costs per ounce and Mine-site All-in Sustaining Costs
The Company adopted an “all-in sustaining costs per ounce” non-GAAP performance measure in accordance with the
For the purposes of calculating "mine-site all-in sustaining costs" at the individual mine-sites, the Company does not include an allocation of corporate and administrative costs and share-based compensation, as detailed in the reconciliations below.
Sustaining capital expenditures are expenditures that do not increase annual gold ounce production at a mine site and excludes all expenditures at the Company’s development projects as well as certain expenditures at the Company’s operating sites that are deemed expansionary in nature. For each mine-site reconciliation, corporate and administrative costs, and non-site specific costs are not included in the all-in sustaining cost per ounce calculation.
All-in sustaining costs per gold ounce is intended to provide additional information only and does not have any standardized meaning under IFRS and may not be comparable to similar measures presented by other mining companies. It should not be considered in isolation or as a substitute for measures of performance prepared in accordance with IFRS.
The measure is not necessarily indicative of cash flow from operations under IFRS or operating costs presented under IFRS.
Total Cash Costs and All-in Sustaining Costs per Ounce Reconciliation Tables
The following tables reconciles these non-GAAP measures to the most directly comparable IFRS measures on a Company-wide and individual mine-site basis.
| Total Cash Costs and AISC Reconciliation - Company-wide | ||||||||||||
| Three Months Ended | Six Months Ended | |||||||||||
| 2023 | 2022 | 2023 | 2022 | |||||||||
| (in millions, except ounces and per ounce figures) | ||||||||||||
| Mining and processing | ||||||||||||
| Royalties | 2.5 | 2.2 | 5.0 | 4.5 | ||||||||
| Total cash costs | 111.7 | 91.4 | 220.6 | 189.1 | ||||||||
| Gold ounces sold | 131,952 | 102,164 | 264,620 | 200,630 | ||||||||
| Total cash costs per ounce | $847 | $895 | $834 | $943 | ||||||||
| Total cash costs | ||||||||||||
| Corporate and administrative(1) | 7.0 | 6.2 | 13.7 | 12.3 | ||||||||
| Sustaining capital expenditures(2) | 23.4 | 20.1 | 50.3 | 42.7 | ||||||||
| Share-based compensation | 2.5 | 0.4 | 13.6 | 6.7 | ||||||||
| Sustaining exploration | 0.5 | 0.6 | 1.2 | 1.3 | ||||||||
| Accretion of decommissioning liabilities | 1.6 | 0.8 | 3.3 | 1.4 | ||||||||
| Total all-in sustaining costs | ||||||||||||
| Gold ounces sold | 131,952 | 102,164 | 264,620 | 200,630 | ||||||||
| All-in sustaining costs per ounce | $1,112 | $1,170 | $1,144 | $1,264 | ||||||||
(1) Corporate and administrative expenses exclude expenses incurred at development properties.
(2) Sustaining capital expenditures are defined as those expenditures which do not increase annual gold ounce production at a mine site and exclude all expenditures at growth projects and certain expenditures at operating sites which are deemed expansionary in nature. Total sustaining capital expenditures for the period are as follows:
| Three Months Ended | Six Months Ended | |||||||||||
| 2023 | 2022 | 2023 | 2022 | |||||||||
| (in millions) | ||||||||||||
| Capital expenditures per cash flow statement | ||||||||||||
| Less: non-sustaining capital expenditures at: | ||||||||||||
| (2.4 | ) | (2.9 | ) | (6.6 | ) | (15.2 | ) | |||||
| Island Gold | (43.7 | ) | (19.8 | ) | (89.3 | ) | (45.4 | ) | ||||
| (5.2 | ) | (20.9 | ) | (8.6 | ) | (42.5 | ) | |||||
| Corporate and other | (5.5 | ) | (5.3 | ) | (9.2 | ) | (10.5 | ) | ||||
| Sustaining capital expenditures | ||||||||||||
| Young-Davidson Total Cash Costs and Mine-site AISC Reconciliation | ||||||||||||
| Three Months Ended | Six Months Ended | |||||||||||
| 2023 | 2022 | 2023 | 2022 | |||||||||
| (in millions, except ounces and per ounce figures) | ||||||||||||
| Mining and processing | ||||||||||||
| Royalties | 1.2 | 1.3 | 2.6 | 2.9 | ||||||||
| Total cash costs | ||||||||||||
| Gold ounces sold | 43,570 | 46,662 | 89,246 | 98,187 | ||||||||
| Total cash costs per ounce | $955 | $866 | $948 | $852 | ||||||||
| Total cash costs | ||||||||||||
| Sustaining capital expenditures | 11.1 | 10.2 | 24.3 | 20.6 | ||||||||
| Accretion of decommissioning liabilities | 0.1 | 0.1 | 0.2 | 0.2 | ||||||||
| Total all-in sustaining costs | ||||||||||||
| Gold ounces sold | 43,570 | 46,662 | 89,246 | 98,187 | ||||||||
| Mine-site all-in sustaining costs per ounce | $1,212 | $1,087 | $1,222 | $1,064 | ||||||||
| Island Gold Total Cash Costs and Mine-site AISC Reconciliation | ||||||||||||
| Three Months Ended | Six Months Ended | |||||||||||
| 2023 | 2022 | 2023 | 2022 | |||||||||
| (in millions, except ounces and per ounce figures) | ||||||||||||
| Mining and processing | ||||||||||||
| Royalties | 0.6 | 0.7 | 1.2 | 1.2 | ||||||||
| Total cash costs | ||||||||||||
| Gold ounces sold | 28,183 | 36,797 | 61,910 | 60,165 | ||||||||
| Total cash costs per ounce | $678 | $590 | $651 | $650 | ||||||||
| Total cash costs | ||||||||||||
| Sustaining capital expenditures | 11.0 | 9.5 | 22.4 | 17.3 | ||||||||
| Accretion of decommissioning liabilities | 0.1 | — | 0.2 | 0.1 | ||||||||
| Total all-in sustaining costs | ||||||||||||
| Gold ounces sold | 28,183 | 36,797 | 61,910 | 60,165 | ||||||||
| Mine-site all-in sustaining costs per ounce | $1,072 | $848 | $1,016 | $939 | ||||||||
| Mulatos District Total Cash Costs and Mine-site AISC Reconciliation | ||||||||||||
| Three Months Ended | Six Months Ended | |||||||||||
| 2023 | 2022 | 2023 | 2022 | |||||||||
| (in millions, except ounces and per ounce figures) | ||||||||||||
| Mining and processing | ||||||||||||
| Royalties | 0.7 | 0.2 | 1.2 | 0.4 | ||||||||
| Total cash costs | ||||||||||||
| Gold ounces sold | 60,199 | 18,705 | 113,464 | 42,278 | ||||||||
| Total cash costs per ounce | $847 | $1,566 | $843 | $1,568 | ||||||||
| Total cash costs | ||||||||||||
| Sustaining capital expenditures | 1.3 | 0.4 | 3.6 | 4.8 | ||||||||
| Sustaining exploration | 0.1 | 0.2 | 0.3 | 0.4 | ||||||||
| Accretion of decommissioning liabilities | 1.4 | 0.7 | 2.9 | 1.1 | ||||||||
| Total all-in sustaining costs | ||||||||||||
| Gold ounces sold | 60,199 | 18,705 | 113,464 | 42,278 | ||||||||
| Mine-site all-in sustaining costs per ounce | $894 | $1,636 | $903 | $1,717 | ||||||||
EBITDA
EBITDA represents net earnings before interest, taxes, depreciation, and amortization. EBITDA is an indicator of the Company’s ability to generate liquidity by producing operating cash flow to fund working capital needs, service debt obligations, and fund capital expenditures.
EBITDA does not have any standardized meaning under IFRS and may not be comparable to similar measures presented by other mining companies. It should not be considered in isolation or as a substitute for measures of performance prepared in accordance with IFRS.
The following is a reconciliation of EBITDA to the consolidated financial statements:
| (in millions) | ||||||||||||
| Three Months Ended | Six Months Ended | |||||||||||
| 2023 | 2022 | 2023 | 2022 | |||||||||
| Net earnings (loss) | ( | ) | ||||||||||
| Add back: | ||||||||||||
| Inventory net realizable value adjustment | — | 22.3 | — | 22.3 | ||||||||
| Impairment charge | — | — | — | 38.2 | ||||||||
| Finance expense | 0.7 | 1.3 | 2.1 | 2.5 | ||||||||
| Amortization | 46.1 | 38.2 | 92.4 | 76.0 | ||||||||
| Deferred income tax expense (recovery) | 2.2 | 23.5 | 2.6 | 17.0 | ||||||||
| Current income tax expense | 14.8 | 0.3 | 38.2 | 1.0 | ||||||||
| EBITDA | $138.9 | $92.0 | $258.8 | $154.9 | ||||||||
Additional GAAP Measures
Additional GAAP measures are presented on the face of the Company’s consolidated statements of comprehensive income (loss) and are not meant to be a substitute for other subtotals or totals presented in accordance with IFRS, but rather should be evaluated in conjunction with such IFRS measures. The following additional GAAP measures are used and are intended to provide an indication of the Company’s mine and operating performance:
- Earnings from operations - represents the amount of earnings before net finance income/expense, foreign exchange gain/loss, other income/loss, loss on redemption of senior secured notes and income tax expense
Unaudited Consolidated Statements of Financial Position, Comprehensive
Income, and Cash Flow
Consolidated Statements of Financial Position
(Unaudited - stated in millions of
| A S S E T S | |||||||
| Current Assets | |||||||
| Cash and cash equivalents | |||||||
| Equity securities | 19.7 | 18.6 | |||||
| Amounts receivable | 36.3 | 37.2 | |||||
| Inventory | 269.0 | 234.2 | |||||
| Other current assets | 21.6 | 16.2 | |||||
| Assets held for sale | — | 5.0 | |||||
| Total Current Assets | 535.2 | 441.0 | |||||
| Non-Current Assets | |||||||
| Mineral property, plant and equipment | 3,249.8 | 3,173.8 | |||||
| Other non-current assets | 60.9 | 59.4 | |||||
| Total Assets | $3,845.9 | $3,674.2 | |||||
| L I A B I L I T I E S | |||||||
| Current Liabilities | |||||||
| Accounts payable and accrued liabilities | |||||||
| Income taxes payable | 36.8 | 0.7 | |||||
| Total Current Liabilities | 212.1 | 181.9 | |||||
| Non-Current Liabilities | |||||||
| Deferred income taxes | 666.0 | 660.9 | |||||
| Decommissioning liabilities | 113.3 | 108.1 | |||||
| Other non-current liabilities | 2.3 | 2.2 | |||||
| Total Liabilities | 993.7 | 953.1 | |||||
| E Q U I T Y | |||||||
| Share capital | |||||||
| Contributed surplus | 87.3 | 90.7 | |||||
| Accumulated other comprehensive loss | (19.8 | ) | (24.8 | ) | |||
| Deficit | (943.7 | ) | (1,048.6 | ) | |||
| Total Equity | 2,852.2 | 2,721.1 | |||||
| Total Liabilities and Equity | $3,845.9 | $3,674.2 | |||||
Consolidated Statements of Comprehensive Income (Loss)
(Unaudited - stated in millions of
| For three months ended | For six months ended | ||||||||||||||
| 2023 | 2022 | 2023 | 2022 | ||||||||||||
| OPERATING REVENUES | |||||||||||||||
| COST OF SALES | |||||||||||||||
| Mining and processing | 109.2 | 89.2 | 215.6 | 184.6 | |||||||||||
| Inventory net realizable value adjustment | — | 22.3 | — | 22.3 | |||||||||||
| Royalties | 2.5 | 2.2 | 5.0 | 4.5 | |||||||||||
| Amortization | 46.1 | 38.2 | 92.4 | 76.0 | |||||||||||
| 157.8 | 151.9 | 313.0 | 287.4 | ||||||||||||
| EXPENSES | |||||||||||||||
| Exploration | 5.1 | 7.0 | 8.6 | 11.1 | |||||||||||
| Corporate and administrative | 7.0 | 6.2 | 13.7 | 12.3 | |||||||||||
| Share-based compensation | 2.5 | 0.4 | 13.6 | 6.7 | |||||||||||
| Impairment | — | — | — | 38.2 | |||||||||||
| 172.4 | 165.5 | 348.9 | 355.7 | ||||||||||||
| EARNINGS BEFORE INCOME TAXES | 88.6 | 25.7 | 163.6 | 20.0 | |||||||||||
| OTHER EXPENSES | |||||||||||||||
| Finance expense | (0.7 | ) | (1.3 | ) | (2.1 | ) | (2.5 | ) | |||||||
| Foreign exchange gain | 1.2 | 0.4 | 1.1 | 0.4 | |||||||||||
| Other gain (loss) | 3.0 | 5.4 | 1.7 | (2.0 | ) | ||||||||||
| EARNINGS FROM OPERATIONS | $92.1 | $30.2 | $164.3 | $15.9 | |||||||||||
| INCOME TAXES | |||||||||||||||
| Current income tax expense | (14.8 | ) | (0.3 | ) | (38.2 | ) | (1.0 | ) | |||||||
| Deferred income tax expense | (2.2 | ) | (23.5 | ) | (2.6 | ) | (17.0 | ) | |||||||
| NET EARNINGS (LOSS) | $75.1 | $6.4 | $123.5 | ($2.1 | ) | ||||||||||
| Items that may be subsequently reclassified to net earnings: | |||||||||||||||
| Net change in fair value of currency hedging instruments, net of taxes | 3.5 | 4.3 | 7.8 | (1.1 | ) | ||||||||||
| Net change in fair value of fuel hedging instruments, net of taxes | — | 0.1 | (0.2 | ) | 1.0 | ||||||||||
| Items that will not be reclassified to net earnings: | |||||||||||||||
| Unrealized loss on equity securities, net of taxes | (4.1 | ) | (10.5 | ) | (2.9 | ) | (13.0 | ) | |||||||
| Total other comprehensive (loss) income | ($0.6 | ) | ($6.1 | ) | $4.7 | ($13.1 | ) | ||||||||
| COMPREHENSIVE INCOME (LOSS) | $74.5 | $0.3 | $128.2 | ($15.2 | ) | ||||||||||
| EARNINGS (LOSS) PER SHARE | |||||||||||||||
| – basic | $0.19 | $0.02 | $0.31 | ($0.01 | ) | ||||||||||
| – diluted | $0.19 | $0.02 | $0.31 | ($0.01 | ) | ||||||||||
Consolidated Statements of Cash Flows
(Unaudited - stated in millions of
| For three months ended | For six months ended | ||||||||||||||
| 2023 | 2022 | 2023 | 2022 | ||||||||||||
| CASH PROVIDED BY (USED IN): | |||||||||||||||
| OPERATING ACTIVITIES | |||||||||||||||
| Net earnings (loss) for the period | ( | ) | |||||||||||||
| Adjustments for items not involving cash: | |||||||||||||||
| Amortization | 46.1 | 38.2 | 92.4 | 76.0 | |||||||||||
| Impairment | — | — | — | 38.2 | |||||||||||
| Inventory net realizable value adjustment | — | 22.3 | — | 22.3 | |||||||||||
| Foreign exchange gain | (1.2 | ) | (0.4 | ) | (1.1 | ) | (0.4 | ) | |||||||
| Current income tax expense | 14.8 | 0.3 | 38.2 | 1.0 | |||||||||||
| Deferred income tax expense | 2.2 | 23.5 | 2.6 | 17.0 | |||||||||||
| Share-based compensation | 2.5 | 0.4 | 13.6 | 6.7 | |||||||||||
| Finance expense | 0.7 | 1.3 | 2.1 | 2.5 | |||||||||||
| Other | (1.9 | ) | (6.7 | ) | (5.8 | ) | (5.0 | ) | |||||||
| Changes in working capital and taxes paid | 3.5 | (9.6 | ) | (29.4 | ) | (34.0 | ) | ||||||||
| 141.8 | 75.7 | 236.1 | 122.2 | ||||||||||||
| INVESTING ACTIVITIES | |||||||||||||||
| Mineral property, plant and equipment | (80.2 | ) | (69.0 | ) | (164.0 | ) | (156.3 | ) | |||||||
| Proceeds from sale of | — | 5.0 | — | 5.0 | |||||||||||
| Proceeds from disposition of equity securities | 0.1 | — | 0.1 | — | |||||||||||
| Investment in equity securities | (0.6 | ) | (2.7 | ) | (1.6 | ) | (2.7 | ) | |||||||
| Manitou transaction costs | (0.2 | ) | — | (0.2 | ) | — | |||||||||
| (80.9 | ) | (66.7 | ) | (165.7 | ) | (154.0 | ) | ||||||||
| FINANCING ACTIVITIES | |||||||||||||||
| Dividends paid | (8.8 | ) | (8.9 | ) | (18.0 | ) | (17.6 | ) | |||||||
| Repurchase and cancellation of common shares | — | (8.2 | ) | — | (8.2 | ) | |||||||||
| Proceeds from issuance of flow-through shares | — | 5.8 | — | 5.8 | |||||||||||
| Proceeds from the exercise of options | 2.1 | — | 5.7 | 0.7 | |||||||||||
| (6.7 | ) | (11.3 | ) | (12.3 | ) | (19.3 | ) | ||||||||
| Effect of exchange rates on cash and cash equivalents | 0.6 | (0.4 | ) | 0.7 | 0.1 | ||||||||||
| Net increase (decrease) in cash and cash equivalents | 54.8 | (2.7 | ) | 58.8 | (51.0 | ) | |||||||||
| Cash and cash equivalents - beginning of period | 133.8 | 124.2 | 129.8 | 172.5 | |||||||||||
| CASH AND CASH EQUIVALENTS - END OF PERIOD | $188.6 | $121.5 | $188.6 | $121.5 | |||||||||||
Photos accompanying this announcement are available at:
https://www.globenewswire.com/NewsRoom/AttachmentNg/c5f7de48-9f6b-40c8-88b6-365885addcdd
https://www.globenewswire.com/NewsRoom/AttachmentNg/1a5f404b-41ad-45f8-b708-c5c69692d34a

![]()
Shaft site area July 2023
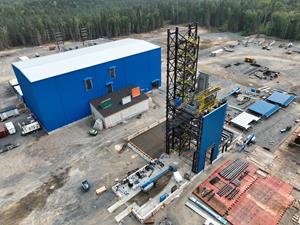
Shaft site area July 2023
Hoist house interior and drums July 2023
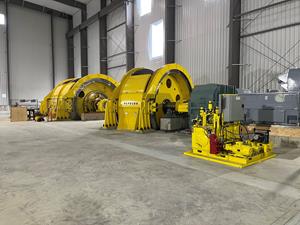
Hoist house interior and drums July 2023
2023 GlobeNewswire, Inc., source

