Daily
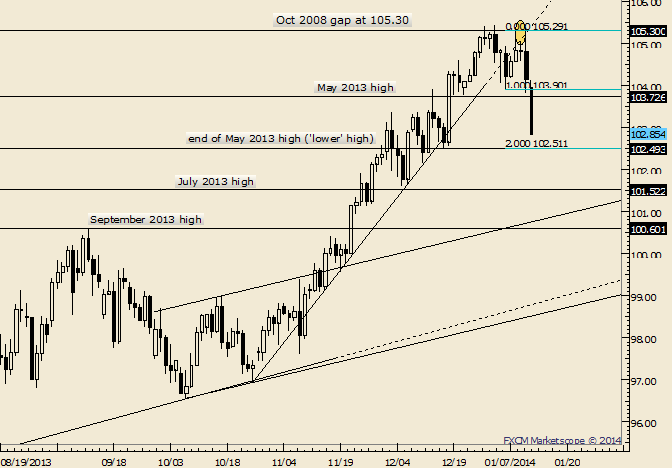
Chart Prepared by Jamie Saettele, CMT using Marketscope 2.0
Automate trades with Mirror Trader and see ideas on other USD crosses
-USDJPY has responded to the previously uncovered close from Oct 2008 at 105.30 (high was 105.43). A cluster of bearish outside days (1/2, 1/6, and 1/10) preceded Monday’s break.
-102.50 is of interest as support. This level was the ‘lower high’ in May 2013, 12/17/13 low and more generally the middle of congestion that took place in the first half of Dec.
Trading Bias: Flat but monitor for support if the market sees 102.50. Long seems like a crowded arena so respect the potential for the rate to overshoot into 101.50/60 (Dec 2013 low, Jul 2013 high, Apr 2009 high, 2005 low). Things could get worse as the S&P confirmed a wedge top on a closing basis today.
LEVELS: 100.60 101.52 102.50 | 103.55 103.90 104.56
--- Written by Jamie Saettele, CMT, Senior Technical Strategist for DailyFX.com
original source


