Today, the experts at Meyers Research, the housing industry’s foremost advisors, released the New Home Pending Sales Index (PSI) for December 2019. The New Home PSI, backed by data from Zonda and Metrostudy, shows pending sales increased year-over-year but declined month-over-month across the United States. The index is a leading residential real estate indicator based on the number of new home sales contracts signed across the country.
This press release features multimedia. View the full release here: https://www.businesswire.com/news/home/20200123005238/en/
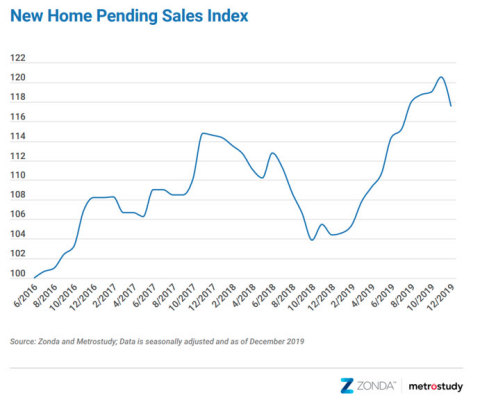
Meyers Research New Home PSI for December 2019 YOY index (Graphic: Business Wire)
The New Home PSI came in at 117.5 for December, representing a 12.5% increase from December 2018. On a month-over-month basis, new home sales decreased by 2.5% between November and December 2019.
“The US economy entered 2020 on a positive note after many top indicators pointed to a strong end to 2019,” said Ali Wolf, director of economic research at Meyers Research. “The housing market is no exception, buoyed by continued job growth, low mortgage rates, and strong demographic tailwinds.”
Nine of the ten key markets grew year-over-year. Los Angeles, San Francisco, and Seattle experienced the most significant growth compared to last year, up 33.4%, 32.4%, and 31.5%, respectively. San Francisco and Orlando were the only markets to increase month-over-month in December.
Given the easy comp from the second half of 2018, looking at the two-year trend is very telling. The national index is 2.5% higher than December 2017. Phoenix and Houston show double-digit increases on a two-year basis, highlighting the strength of the local housing markets. December home sales also show momentum in Dallas and Denver compared to December 2017.
The strong annual clip for Los Angeles and San Francisco is less robust when put in content. Both markets are lower compared to two years ago, with Los Angeles sales 23.7% below December 2017 and San Francisco down 28.2%. Los Angeles new home sales are 24.5% below the market’s May 2017 peak. San Francisco’s peak in home sales was March 2017 and current levels are 33.6% below that.
“Looking ahead, a heated election year, slowing global growth, and housing affordability concerns will be top-of-mind for buyers,” said Wolf. “There’s still a desire to own a home, especially for Millennials, but we need to keep our eyes on how confidence trends in the early-months of 2020.”
New home data is susceptible to outsized swings in contract activity based on shifts in the number of actively selling communities. As a result, Meyers Research normalizes the data to ensure consistency across the index. The New Home PSI blends the cumulative sales of active or recently sold-out projects with the average sales rate per community, which adjusts for fluctuations in supply. Furthermore, the New Home PSI is seasonally adjusted based on each markets’ specific seasonality and removes outliers. The index is baselined to 100 for June 2016. Today’s national New Home PSI is 17.5% above the base level.
The next Meyers Research New Home PSI press release, featuring January 2020 data, will be issued on Monday, February 24, 2020 at 9:00 a.m. ET.
Methodology
The Meyers Research New Home Pending Sales Index (PSI) is built on proprietary, industry-leading data that covers 60% of the production new home market across the United States. Reported number of new home pending contracts are gathered and analyzed each month. Released on the 15th business day of each month, the New Home PSI is a leading indicator of housing demand compared to closings because it is based on the number of signed contracts at a new home community. Meyers Research monitors 18,000 active communities in the country and the homes tracked can be in any stage of construction.
The new home market represents roughly 10% of all transactions, allowing little movements in supply to cause outsized swings in market activity. As a result, the New Home PSI blends the cumulative sales of activity recently sold out projects with the average sales rate per community, which adjusts for fluctuations in supply. Furthermore, the New Home PSI is seasonally adjusted based on each markets’ specific seasonality, removes outliers, and uses June 2016 as the base month. The foundation of the index is a monthly survey conducted by Meyers Research. It is necessary to monitor both new and existing home sales to establish an accurate picture of the relative health of the residential real estate market.
About Meyers Research
Meyers Research represents the housing industry’s leading provider of rich data, backed by Zonda and Metrostudy, and the industry’s top advisors for residential real estate development and new home construction. With products and services geared for homebuilders, multifamily developers, lenders, and financial institutions, we provide innovative solutions to maximize opportunities in today's real estate development landscape. To learn more, visit meyersresearchllc.com.
Meyers Research, Hanley Wood, Zonda, Metrostudy, and the company logo, are trademarks of Meyers Research, LLC and/or its subsidiaries.
View source version on businesswire.com: https://www.businesswire.com/news/home/20200123005238/en/


