Talking Points:
- 2 Breakouts on CAD/JPY Daily Chart
- Consolidation Pattern & Key Support Zone
- The Ideal Time Frame for Initiating New Longs
Trend line analysis can usually be done in a straightforward yet powerful manner. However, on occasion, there arises the potential for interesting combinations, and today's trade is one such example.
As seen on the daily chart below of CADJPY, the original downtrend was broken at the end of March. As the rising channel shows, the expectation was that an uptrend could have developed. However, the latest break of the rising support line suggests either that the downtrend could be resuming, or that a larger consolidation area is developing.
Guest Commentary: Dual Breakouts on CAD/JPY Daily Chart
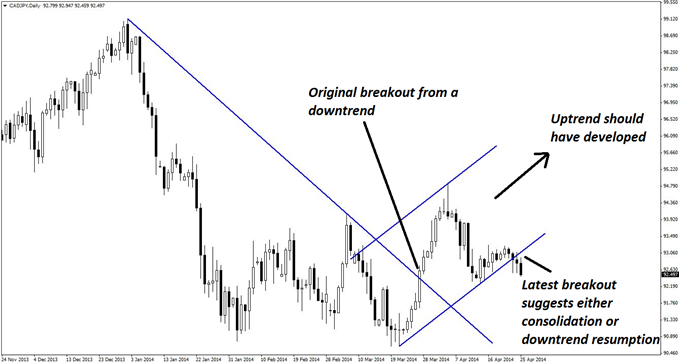
Regardless of whether it is starting a downtrend or simply a consolidation, price is expected to at least test the underside of the trend line before confirming that the uptrend has truly ended. Thus, the most immediate trade is to the long side. If the break turns out to be false, then there could well be a journey of 250 pips or more to retest the highs. If it proves true, however, there would be more than 60 pips before price tests the trend line again.
The four-hour chart below offers a slightly different perspective on this trade, as it sketches out a sideways consolidation. The depth of this range is approximately 90 pips, which leaves plenty of room for long trades to unfold.
Guest Commentary: Key Support Zone for Buying CAD/JPY
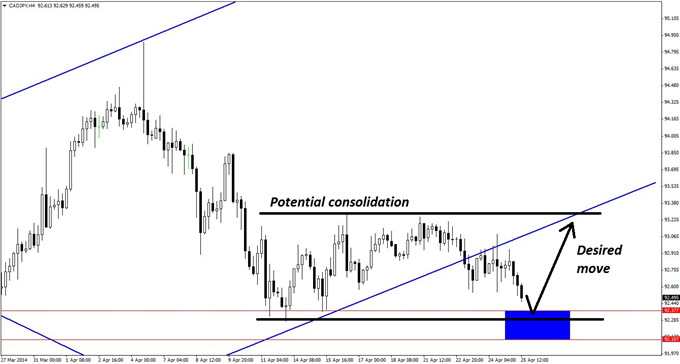
The chosen support zone is defined as 92.10-92.37, and it is actually an interesting study in itself. The higher value is the approximate area of the recent lows. However, the best trade would actually occur if price dips slightly lower than the recent low, creating "head-fake" scenario.
By textbook theory, this would cause the bears to begin selling on the breakout. Should price then turn back up, the momentum generated by sellers hastily covering their positions should help springboard price back up to (perhaps quickly) test the top of the range.
The hourly chart below is notable for how featureless it is in relation to the other patterns. Besides a potential declining channel, there is little to be said for this decline. This is worth noting, as it means that many of the recent swings have overlapped with one another.
Guest Commentary: Ideal Time Frame for New CAD/JPY Longs
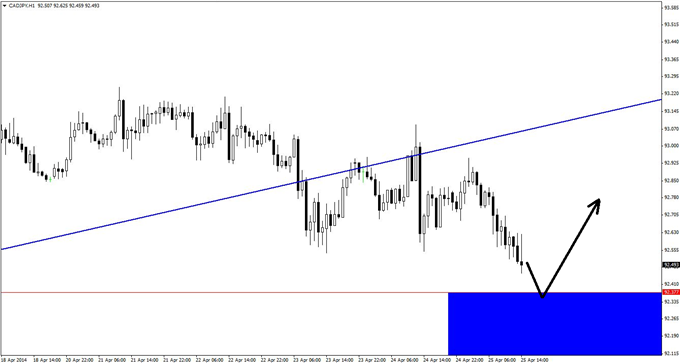
Even though the general movement has been mildly bearish, it essentially shows a market that could develop into a trend rather suddenly. Of course, it is hoped that this trend will be in the upward direction, but it could also be to the downside. As there is no way of telling until history is created, the best response is to trade the long side on signs such as bullish reversal divergence, bullish engulfing patterns, and/or pin bars on the short-term time frames.
Risk is likely to be quite small for this trade given that the average candlestick is approximately only ten pips deep at this hourly level of magnification. This certainly helps to justify taking this trade, and also justifies taking two or three tries at the entry in order to successfully capitalize on a potential upside move.
By Kaye Lee, private fund trader and head trader consultant, StraightTalkTrading.com
original source


