
Instead, as followers know, we opted for a selection of Oilers, Copper Miners and Gold & Silver Miners where commodity prices are still early in the cycle bottoming process, not in the late stages of the cycle as they are for forest products.
In any case, we did review the following six Forest Product companies, looking for anomalies in the fundamental data that might cause us to look a bit deeper for potential investments following a significant Bear phase or full-out Bear market for equities:
WY Weyerhaeuser
RYN Rayonier
PCH Potlatch Corp
CTT CatchMark Timber
RFP Resolute Forest Products
FBR Fibria Celulose
We wanted to include UFPI, Universal Forest Products Inc, in this review; however, with fewer than four industry analysts reporting to Thomson Reuters and 4-Traders, which are our big data sources for these studies, we decided to leave it for now.
In our 140-stock candidate list for research and possible inclusion in our portfolio, we selected only four forest product companies: Weyerhaeuser, Rayonier, Potlatch Corp and Fibria Celulose (WY, RYN, PCH and FBR). Two others we reviewed, CatchMark and Resolute Forest Products, while some investors may possibly consider them fundamentally good companies, are a bit too small and have many gaps in the data to meet our investment needs.
To save the suspense, we found one company, Fibria Celulose (FBR), that is clearly the best in Revenue Growth and Profitability. Long-time readers know FBR as a Cara 100 favorite over the years. Throughout the past year, this major Brazilian pulp producer has substantially outperformed most companies in the full universe in Revenue and Earnings Per Share revisions, which are important criteria in our analytic studies. Yet, we are not invested in FBR because we believe the stock is over-priced.
For various reasons we are not invested in any of the six. If anything, some of these companies are relatively high dividend payers, which might at times play a role in prudent investment management, but even for Yield there are better choices in the market.
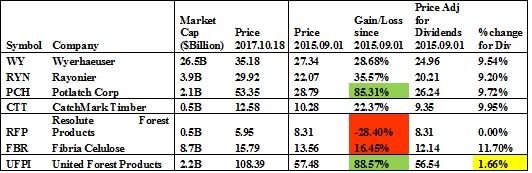
The data for this peer group shows that the Dividend Yields presently range from 4.29% for CatchMark, 3.52% for Weyerhaeuser, 3.34% for Rayonier, 2.81% for Potlatch, and 1.33% for Fibria Celulose. Resolute Forest Products has paid no dividend.
Of all companies analyzed by our big data vendor and ranked for Yield: CatchMark, Weyerhaeuser, Rayonier and Potlatch are ranked 85%, 80%, 78% and 73% respectively while Fibria Celulose is just 42%. So; if it’s dividend yield you are seeking there are four that may meet your needs. Resolute Forest Products is not paying a dividend.
In terms of the stock prices keeping up with the approximate +86% rise in Lumber prices over the past two years, only Potlatch of this group has managed a gain of +85.3% based on closing prices at 2017.10.19. As the following table shows, the other five have been relatively disappointing.
The Universal Forest Products Co that we did not study did manage a gain of +88.6%, but its Dividend Yield has been disappointing. In any case, we are here to study the other six companies.
In terms of the Fundamentals Rankings against a universe of thousands of companies followed by four or more analysts who report their findings, let’s have a look at the winners and losers.
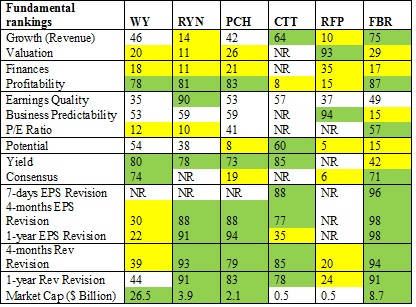
Fundamental Rankings:
1. Revenue Growth, which is based on the evolution of the turnover of the company between the last year and the three coming years according to consensus estimates. The higher the growth is (from a relative viewpoint), the better the rating is. The goal is to rank companies according to estimated sales and to identify companies with the highest growth.
a. Winners: FBR is clear winner. CTT not bad, but also not great
b. Losers: RFP is bad due to declining newsprint industry and RYN is not very good
2. Valuation, which is based on the ratio between enterprise value and its turnover for the current fiscal year and the next one. The lower the valuation is, the better the rating is. The goal is to rank companies according to valuation and to identify companies with the lowest valuation.
a. Winners: RFP is outstanding on this score; but, most investors are unimpressed
b. Losers: All the others are quite poor
3. Finances, which is based on the evolution of the net debt of the company (debt or cash) and its EBITDA, compared to its revenue. The higher the cash is, the better the rating is. The goal is to rank companies according to financial situation and to identify companies with the highest growth. The goal is to rank companies according to the quality of their financial situation.
a. Winners: None
b. Losers: All are not financial powerhouses; but Debt/Equity at PCH may be a concern to some.
4. Profitability, which is based on net margin of the company for the current year and the next one according to consensus estimates. The higher the ratio is, the better the rating is. The goal is to rank companies according to the “Net income/revenue” ratio to identify those which have a high payoff.
a. Winners: FBR is clearly the best. PCH, RYN and WY are very good
b. Losers: CTT and RFP are bad
5. Earnings quality, which is based on quality of past earnings released by the company compared to analysts’ estimates. The better earnings release is, the higher the rating is. The companies closest to the consensus will have an average score. The goal is to identify companies that publish regularly above consensus.
a. Winners: Only RYN
b. Losers: WY and RFP are the weakest
6. Business Predictability, which is based on the dispersion of analysts' estimates on the evolution of the company business in the coming years (range estimates). The more estimates are concentrated, the more the rating is high. The goal is to rank companies according to the predictability of their business and identify companies whose business is highly predictable.
a. Winners: RFP is excellent
b. Losers: The others are better than average, which is surprising because Lumber prices are quite volatile. FBR, a pulp producer, is worst.
7. Price Earnings Ratio, which compared the company’s current share price to its per-share earnings for the current fiscal year and the next one. The lower the PER is, the better the rating is. The goal is to rank companies according to their earnings multiples and identify those which are cheap.
a. Winners: FBR is better than average. PCH is the best of the rest on this score as prices in this peer group are overly inflated at present
b. Losers: RYN and WY are very bad
8. Potential, which is based on the average target price fixed by the consensus from Thomson Reuters. The higher the target price is, the better the rating is. The goal is to identify companies that have, according to analysts, the strongest upside potential.
a. Winners: CTT and WY are barely above average
b. Losers: RFP, PCH and FBR have very little price upside according to the analysts
9. Yield, which is based on the dividend relative to its share price. The higher the dividend yield is, the better the rating is. The goal is to identify companies that can supply a significant dividend return to their shareholders.
a. Winners: CTT, WY, RYN and PCH are all very good
b. Losers: RFP
10. Consensus, which is based on analyst recommendations. It provides an indication of the position taken by most analysts polled by Thomson Reuters. The goal is to identify companies that benefit from the maximum of buy (or sell) recommendations.
a. Winners: WY and FBR are two companies/stocks the analysts seem to like
b. Losers: RYN (terrible) and RYN (bad) are losers. The others are unrated.
11. EPS revisions (one week), which is based on the evolution of EPS (earnings per share) revisions of the company for the current fiscal year and the next one. During the last week, more EPS estimates are revised upward (from a relative point of view), the more rating is high. The goal is to rank companies according to analyst estimates and to identify companies with the best EPS estimates.
a. Winners: FBR and CTT recently reported very strong EPS growth
b. Losers: None of the others reported in the past week
12. EPS revisions (four months), which is based on the evolution of EPS (earnings per share) revisions of the company for the current fiscal year and the next one. During the last four months, more EPS estimates are revised upward (from a relative point of view), the more rating is high. The goal is to rank companies according to analyst estimates and to identify companies with the best EPS estimates. The difference is that the period of observation is based on fourth month instead of one week.
a. Winners: FBR is ranked 98% best while RYN and PCH are highly ranked at 88% and CTT is also a solid performer
b. Losers: WY
13. EPS revisions (one year), which is based on the evolution of EPS (earnings per share) revisions of the company for the current fiscal year and the next one. The more EPS estimates are revised upward (from a relative point of view), the more rating is high. The goal is to rank companies according to analyst estimates and to identify companies with the best EPS estimates. The difference is that the period is three times as long as EPS revisions (four months).
a. Winners: FBR at 98% and PCH and RYN at over 90% have been outstanding too
b. Losers: WY is the worst and CTT not much better
14. Revenue revisions (four months), which is based on the evolution of revenue revisions of the company for the current fiscal year and the next one. The more revenue estimates are revised upward (from a relative point of view), the more rating is high. The goal is to rank companies according to analyst estimates and to identify companies with the best revenue estimates.
a. Winners: FBR at 94% and RYN at 93% are clear winners; but CTT and PCH are also very good
b. Losers: RFP was disappointing
15. Revenue revisions (one year) rating is based on the evolution of revenue revisions of the company for the current fiscal year and the next one. The more revenue estimates are revised upward (from a relative point of view), the more rating is high. The goal is to rank companies according to analyst estimates and to identify companies with the best revenue estimates. The difference is that the period is three times as long as Revenue revisions (four months).
a. Winners: FBR and RYN at 94% and 91% are superior while PCH and CTT are also highly ranked as one would expect with high commodity prices
b. Losers: RFP was disappointing
Summary
With soaring commodity prices in this industry, with Lumber futures trading at the highest level in over 13 years, one might reasonably expect the substantial upward revisions in Revenue and EPS this peer group has exhibited in the past year. The fact the stock prices of this group of six companies is up an average of about +24% YTD and +36% Y/Y also may not be surprising for the same reason. But our job as quantitatively based, long-cycle investors is to anticipate macroeconomic conditions in the future and make decisions on how these companies will likely perform under those conditions. Our objective is to invest ahead of the crowd, when stock prices are out of favor, and to take gains at times we believe the prices have become inflated. At this point, we believe that Lumber prices are excessive and that forest product industry stock prices are too high across the board and do not reflect the value we want for buying entry positions.
So, to the question, should we buy Forest Products stocks today, our answer is that no, the risk-reward balance is unacceptable, and if we did hold them we would consider timely exits of those positions. As we see it, even short-term traders will likely experience lower prices over the next few weeks and months.
At favorable entry points in the long cycle, we are inclined to invest in the shares of Brazilian-based Fibria Celulose (FBR), whose shares are held 59.5% in total, about half each, by the Moraes Family and Bndes Participações S.A. (Bndespar), which is the investment arm of Brazil's national development bank, BNDES. In addition to the strong ownership, the industry and corporate reporting data shows this company is fundamentally very strong and clearly superior to its peers. The problem for us is that we buy on weakness and sell on strength the shares of fundamentally strong companies like Fibria Celulose. However, at this point, FBR is up +46.8% in the past 3 Months, +76.8% in 6 Months and +116.9% in 12 Months. Compare that to the next best performance in this peer group, Potlatch Corp (PCH), which is up +14.0% for 6 Months and +35.4% for 12 Months. We see the potential for a -25% decline in FBR within the next six months. On substantial weakness, we would be inclined to be a buyer, however.


