“It was a solid start to the year, with performance across our key financial metrics as expected,” said
First Quarter 2024 Financial and Business Highlights
- Total revenue was
$306.1 million , an increase of 19% compared to the first quarter of 2023. - Total enrolled pets (including pets from our other business segment) was 1,708,017 at
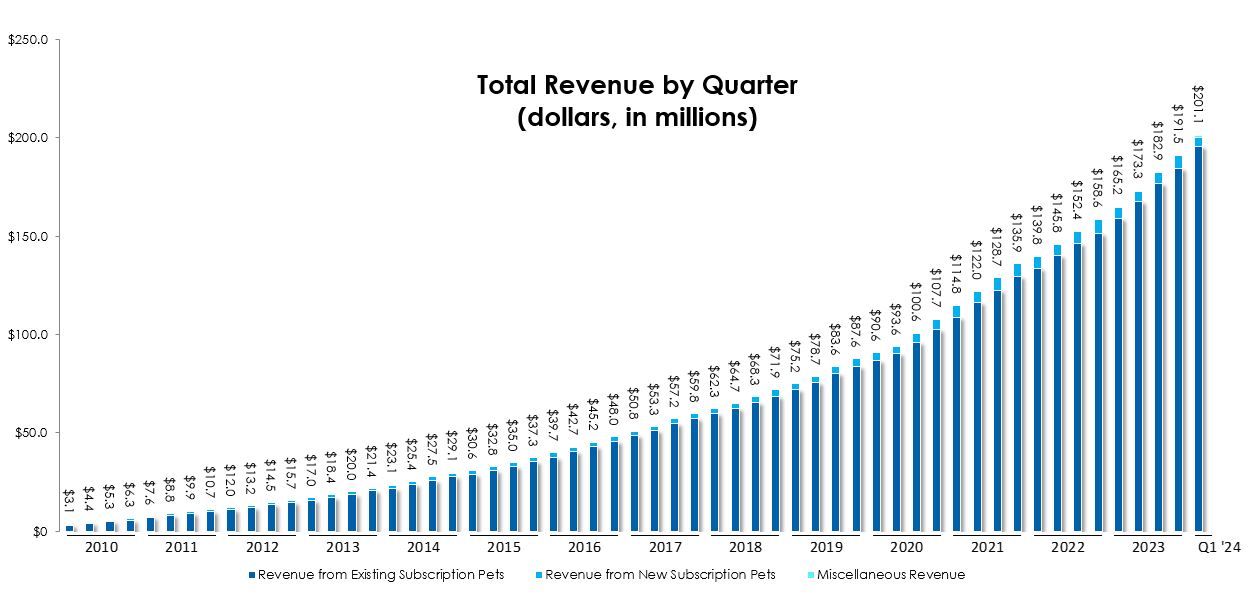
March 31, 2024 , an increase of 6% overMarch 31, 2023 . - Subscription business revenue was
$201.1 million , an increase of 22% compared to the first quarter of 2023. - Subscription enrolled pets was 1,006,168 at
March 31, 2024 , an increase of 11% overMarch 31, 2023 . - Net loss was
$(6.9) million , or$(0.16) per basic and diluted share, compared to net loss of$(24.8) million , or$(0.60) per basic and diluted share, in the first quarter of 2023. - Adjusted EBITDA was
$4.8 million , compared to adjusted EBITDA of$(4.9) million in the first quarter of 2023. - Operating cash flow was
$2.4 million and free cash flow was$(0.6) million in the first quarter of 2024. This compared to operating cash flow of$(6.9) million and free cash flow of$(12.0) million in the first quarter of 2023. - At
March 31, 2024 , the Company held$275.2 million in cash and short-term investments, including$38.1 million held outside the insurance entities, with an additional$15 million available under its credit facility. - The Company maintained
$256.7 million of capital surplus at its insurance subsidiaries. This was$103.4 million more than the estimated risk-based capital requirement of$153.3 million .
Today, in a separate release, the Company announced that its board of directors has unanimously approved the appointment of
Conference Call
Trupanion’s management will host a conference call today to review its first quarter 2024 results. The call is scheduled to begin shortly after
About
Forward-Looking Statements
This press release contains forward-looking statements within the meaning of Section 27A of the Securities Act of 1933 and Section 21E of the Securities Exchange Act of 1934 relating to, among other things, expectations, plans, prospects and financial results for
In particular, the following factors, among others, could cause results to differ materially from those expressed or implied by such forward-looking statements: the ability to achieve or maintain profitability and/or appropriate levels of cash flow in future periods; the ability to keep growing our membership base and revenue; the accuracy of assumptions used in determining appropriate member acquisition expenditures; the severity and frequency of claims; the ability to maintain high retention rates; the accuracy of assumptions used in pricing medical plan subscriptions and the ability to accurately estimate the impact of new products or offerings on claims frequency; actual claims expense exceeding estimates; regulatory and other constraints on the ability to institute, or the decision to otherwise delay, pricing modifications in response to changes in actual or estimated claims expense; the effectiveness and statutory or regulatory compliance of our Territory Partner model and of our
For a detailed discussion of these and other cautionary statements, please refer to the risk factors discussed in filings with the
Non-GAAP Financial Measures
Trupanion’s stated results may include certain non-GAAP financial measures. These non-GAAP financial measures may not provide information that is directly comparable to that provided by other companies in its industry as other companies in its industry may calculate or use non-GAAP financial measures differently. In addition, there are limitations in using non-GAAP financial measures because the non-GAAP financial measures are not prepared in accordance with GAAP, may be different from non-GAAP financial measures used by other companies and exclude expenses that may have a material impact on Trupanion’s reported financial results. The presentation and utilization of non-GAAP financial measures is not meant to be considered in isolation or as a substitute for the directly comparable financial measures prepared in accordance with GAAP.
Because of varying available valuation methodologies, subjective assumptions and the variety of equity instruments that can impact a company’s non-cash expenses,
Condensed Consolidated Statements of Operations (in thousands, except share data) | ||||||||
| Three Months Ended | ||||||||
| 2024 | 2023 | |||||||
| (unaudited) | ||||||||
| Revenue: | ||||||||
| Subscription business | $ | 201,134 | $ | 165,210 | ||||
| Other business | 104,987 | 91,119 | ||||||
| Total revenue | 306,121 | 256,329 | ||||||
| Cost of revenue: | ||||||||
| Subscription business(1) | 172,132 | 146,091 | ||||||
| Other business | 97,762 | 83,892 | ||||||
| Total cost of revenue(2) | 269,894 | 229,983 | ||||||
| Operating expenses: | ||||||||
| Technology and development(1) | 6,960 | 4,900 | ||||||
| General and administrative(1) | 14,673 | 21,017 | ||||||
| New pet acquisition expense(1) | 16,843 | 21,642 | ||||||
| Depreciation and amortization | 3,785 | 3,202 | ||||||
| Total operating expenses | 42,261 | 50,761 | ||||||
| Loss from investment in joint venture | (103 | ) | (71 | ) | ||||
| Operating loss | (6,137 | ) | (24,486 | ) | ||||
| Interest expense | 3,596 | 2,387 | ||||||
| Other income, net | (2,843 | ) | (1,902 | ) | ||||
| Loss before income taxes | (6,890 | ) | (24,971 | ) | ||||
| Income tax benefit | (38 | ) | (191 | ) | ||||
| Net loss | $ | (6,852 | ) | $ | (24,780 | ) | ||
| Net loss per share: | ||||||||
| Basic and diluted | $ | (0.16 | ) | $ | (0.60 | ) | ||
| Weighted average shares of common stock outstanding: | ||||||||
| Basic and diluted | 41,917,094 | 41,107,889 | ||||||
| (1)Includes stock-based compensation expense as follows: | Three Months Ended | |||||||
| 2024 | 2023 | |||||||
| Cost of revenue | $ | 1,390 | $ | 1,318 | ||||
| Technology and development | 1,254 | 708 | ||||||
| General and administrative | 3,449 | 8,219 | ||||||
| New pet acquisition expense | 2,059 | 2,086 | ||||||
| Total stock-based compensation expense | $ | 8,152 | $ | 12,331 | ||||
| (2)The breakout of cost of revenue between veterinary invoice expense and other cost of revenue is as follows: | ||||||||
| Three Months Ended | ||||||||
| 2024 | 2023 | |||||||
| Veterinary invoice expense | $ | 233,569 | $ | 194,137 | ||||
| Other cost of revenue | 36,325 | 35,846 | ||||||
| Total cost of revenue | $ | 269,894 | $ | 229,983 | ||||
Condensed Consolidated Balance Sheets (in thousands, except share data) | ||||||||
| (unaudited) | ||||||||
| Assets | ||||||||
| Current assets: | ||||||||
| Cash and cash equivalents | $ | 146,455 | $ | 147,501 | ||||
| Short-term investments | 128,734 | 129,667 | ||||||
| Accounts and other receivables, net of allowance for doubtful accounts of | 278,492 | 267,899 | ||||||
| Prepaid expenses and other assets | 17,084 | 17,022 | ||||||
| Total current assets | 570,765 | 562,089 | ||||||
| Restricted cash | 23,106 | 22,963 | ||||||
| Long-term investments | 13,007 | 12,866 | ||||||
| Property, equipment and internal-use software, net | 104,365 | 103,650 | ||||||
| Intangible assets, net | 17,221 | 18,745 | ||||||
| Other long-term assets | 18,013 | 18,922 | ||||||
| 42,983 | 43,713 | |||||||
| Total assets | $ | 789,460 | $ | 782,948 | ||||
| Liabilities and stockholders’ equity | ||||||||
| Current liabilities: | ||||||||
| Accounts payable | $ | 8,348 | $ | 10,505 | ||||
| Accrued liabilities and other current liabilities | 30,473 | 34,052 | ||||||
| Reserve for veterinary invoices | 62,275 | 63,238 | ||||||
| Deferred revenue | 249,135 | 235,329 | ||||||
| Long-term debt - current portion | 1,350 | 1,350 | ||||||
| Total current liabilities | 351,581 | 344,474 | ||||||
| Long-term debt | 127,482 | 127,580 | ||||||
| Deferred tax liabilities | 2,399 | 2,685 | ||||||
| Other liabilities | 4,627 | 4,487 | ||||||
| Total liabilities | 486,089 | 479,226 | ||||||
| Stockholders’ equity: | ||||||||
| Common stock: | — | — | ||||||
| Preferred stock: | — | — | ||||||
| Additional paid-in capital | 544,593 | 536,108 | ||||||
| Accumulated other comprehensive loss | (1,581 | ) | 403 | |||||
| Accumulated deficit | (223,107 | ) | (216,255 | ) | ||||
| (16,534 | ) | (16,534 | ) | |||||
| Total stockholders’ equity | 303,371 | 303,722 | ||||||
| Total liabilities and stockholders’ equity | $ | 789,460 | $ | 782,948 | ||||
Condensed Consolidated Statements of Cash Flows (in thousands) | ||||||||
| Three Months Ended | ||||||||
| 2024 | 2023 | |||||||
| (unaudited) | ||||||||
| Operating activities | ||||||||
| Net loss | $ | (6,852 | ) | $ | (24,780 | ) | ||
| Adjustments to reconcile net loss to cash provided by (used in) operating activities: | ||||||||
| Depreciation and amortization | 3,785 | 3,202 | ||||||
| Stock-based compensation expense | 8,152 | 12,331 | ||||||
| Other, net | (202 | ) | (397 | ) | ||||
| Changes in operating assets and liabilities: | ||||||||
| Accounts and other receivables | (10,718 | ) | (15,847 | ) | ||||
| Prepaid expenses and other assets | 287 | (3,765 | ) | |||||
| Accounts payable, accrued liabilities, and other liabilities | (5,131 | ) | (5,148 | ) | ||||
| Reserve for veterinary invoices | (885 | ) | 4,606 | |||||
| Deferred revenue | 13,998 | 22,936 | ||||||
| Net cash provided by (used in) operating activities | 2,434 | (6,862 | ) | |||||
| Investing activities | ||||||||
| Purchases of investment securities | (19,193 | ) | (34,795 | ) | ||||
| Maturities and sales of investment securities | 19,005 | 73,793 | ||||||
| Purchases of property, equipment, and internal-use software | (3,065 | ) | (5,184 | ) | ||||
| Other | 516 | 100 | ||||||
| Net cash provided by (used in) investing activities | (2,737 | ) | 33,914 | |||||
| Financing activities | ||||||||
| Proceeds from debt financing, net of financing fees | — | 35,130 | ||||||
| Repayment of debt financing | (338 | ) | (607 | ) | ||||
| Repurchases of common stock | — | — | ||||||
| Proceeds from exercise of stock options | 372 | 140 | ||||||
| Shares withheld to satisfy tax withholding | (245 | ) | (853 | ) | ||||
| Other | (75 | ) | — | |||||
| Net cash provided by (used in) financing activities | (286 | ) | 33,810 | |||||
| Effect of foreign exchange rate changes on cash, cash equivalents, and restricted cash, net | (313 | ) | 260 | |||||
| Net change in cash, cash equivalents, and restricted cash | (902 | ) | 61,122 | |||||
| Cash, cash equivalents, and restricted cash at beginning of period | 170,464 | 84,637 | ||||||
| Cash, cash equivalents, and restricted cash at end of period | $ | 169,562 | $ | 145,759 | ||||
| The following table sets forth our key operating metrics. | |||||||||||||||||||||||||||||||
| Three Months Ended | |||||||||||||||||||||||||||||||
2024 | 2023 | 2023 | 2023 | 2023 | 2022 | 2022 | 2022 | ||||||||||||||||||||||||
| Total Business: | |||||||||||||||||||||||||||||||
| Total pets enrolled (at period end) | 1,708,017 | 1,714,473 | 1,712,177 | 1,679,659 | 1,616,865 | 1,537,573 | 1,439,605 | 1,348,145 | |||||||||||||||||||||||
| Subscription Business: | |||||||||||||||||||||||||||||||
| Total subscription pets enrolled (at period end) | 1,006,168 | 991,426 | 969,322 | 943,958 | 906,369 | 869,862 | 808,077 | 770,318 | |||||||||||||||||||||||
| Monthly average revenue per pet | $ | 69.79 | $ | 67.07 | $ | 65.82 | $ | 64.41 | $ | 63.58 | $ | 63.11 | $ | 63.80 | $ | 64.26 | |||||||||||||||
| Lifetime value of a pet, including fixed expenses | $ | 428 | $ | 419 | $ | 428 | $ | 470 | $ | 541 | $ | 641 | $ | 673 | $ | 713 | |||||||||||||||
| Average pet acquisition cost (PAC) | $ | 207 | $ | 217 | $ | 212 | $ | 236 | $ | 247 | $ | 283 | $ | 268 | $ | 309 | |||||||||||||||
| Average monthly retention | 98.41 | % | 98.49 | % | 98.55 | % | 98.61 | % | 98.65 | % | 98.69 | % | 98.71 | % | 98.74 | % | |||||||||||||||
| The following table reflects the reconciliation of cash provided by operating activities to free cash flow (in thousands): | ||||||||
| Three Months Ended | ||||||||
| 2024 | 2023 | |||||||
| Net cash provided by (used in) operating activities | $ | 2,434 | $ | (6,862 | ) | |||
| Purchases of property, equipment, and internal-use software | (3,065 | ) | (5,184 | ) | ||||
| Free cash flow | $ | (631 | ) | $ | (12,046 | ) | ||
| The following tables reflect the reconciliation between GAAP and non-GAAP measures (in thousands except percentages): | ||||||||
| Three Months ended | ||||||||
| 2024 | 2023 | |||||||
| Veterinary invoice expense | $ | 233,569 | $ | 194,137 | ||||
| Less: | ||||||||
| Stock-based compensation expense(1) | (862 | ) | (839 | ) | ||||
| Other business cost of paying veterinary invoices(4) | (81,213 | ) | (65,149 | ) | ||||
| Subscription cost of paying veterinary invoices (non-GAAP) | $ | 151,494 | $ | 128,149 | ||||
| % of subscription revenue | 75.3 | % | 77.6 | % | ||||
| Other cost of revenue | $ | 36,325 | $ | 35,846 | ||||
| Less: | ||||||||
| Stock-based compensation expense(1) | (420 | ) | (448 | ) | ||||
| Other business variable expenses(4) | (16,498 | ) | (18,743 | ) | ||||
| Subscription variable expenses (non-GAAP) | $ | 19,407 | $ | 16,655 | ||||
| % of subscription revenue | 9.6 | % | 10.1 | % | ||||
| Technology and development expense | $ | 6,960 | $ | 4,900 | ||||
| General and administrative expense | 14,673 | 21,017 | ||||||
| Less: | ||||||||
| Stock-based compensation expense(1) | (4,258 | ) | (8,821 | ) | ||||
| Non-recurring transaction or restructuring expenses(2) | — | (4,102 | ) | |||||
| Development expenses(3) | (1,178 | ) | (898 | ) | ||||
| Fixed expenses (non-GAAP) | $ | 16,197 | $ | 12,096 | ||||
| % of total revenue | 5.3 | % | 4.7 | % | ||||
| New pet acquisition expense | $ | 16,843 | $ | 21,642 | ||||
| Less: | ||||||||
| Stock-based compensation expense(1) | (1,857 | ) | (2,032 | ) | ||||
| Other business pet acquisition expense(4) | (13 | ) | (51 | ) | ||||
| Subscription acquisition cost (non-GAAP) | $ | 14,973 | $ | 19,559 | ||||
| % of subscription revenue | 7.4 | % | 11.8 | % | ||||
| 1 | ||||||||
| 2 Consists of business acquisition transaction expenses, severance and legal costs due to certain officers' departures, and a | ||||||||
| 3 Consists of costs related to product exploration and development that are pre-revenue and historically have been insignificant. | ||||||||
| 4 Excluding the portion of stock-based compensation expense attributable to the other business segment. | ||||||||
| The following tables reflect the reconciliation of GAAP measures to non-GAAP measures (in thousands, except percentages): | ||||||||
| Three Months Ended | ||||||||
| 2024 | 2023 | |||||||
| Operating Income | $ | (6,138 | ) | $ | (24,485 | ) | ||
| Non-GAAP expense adjustments | ||||||||
| Acquisition cost | 14,985 | 19,611 | ||||||
| Stock-based compensation expense(1) | 7,398 | 12,140 | ||||||
| Development expenses(3) | 1,179 | 898 | ||||||
| Depreciation and amortization | 3,785 | 3,202 | ||||||
| Non-recurring transaction or restructuring expenses(2) | — | 4,102 | ||||||
| Gain (loss) from investment in joint venture | (103 | ) | (71 | ) | ||||
| Total adjusted operating income (non-GAAP) | $ | 21,312 | $ | 15,538 | ||||
| Subscription Business: | ||||||||
| Subscription operating income | $ | (4,525 | ) | $ | (21,240 | ) | ||
| Non-GAAP expense adjustments | ||||||||
| Acquisition cost | 14,973 | 19,560 | ||||||
| Stock-based compensation expense(1) | 5,882 | 9,004 | ||||||
| Development expenses(3) | 774 | 579 | ||||||
| Depreciation and amortization | 2,487 | 2,064 | ||||||
| Non-recurring transaction or restructuring expenses(2) | — | 2,644 | ||||||
| Subscription adjusted operating income (non-GAAP) | $ | 19,591 | $ | 12,610 | ||||
| Other Business: | ||||||||
| Other business operating income | $ | (1,510 | ) | $ | (3,174 | ) | ||
| Non-GAAP expense adjustments | ||||||||
| Acquisition cost | 12 | 51 | ||||||
| Stock-based compensation expense(1) | 1,516 | 3,136 | ||||||
| Development expenses(3) | 404 | 319 | ||||||
| Depreciation and amortization | 1,298 | 1,138 | ||||||
| Non-recurring transaction or restructuring expenses(2) | — | 1,458 | ||||||
| Other business adjusted operating income (non-GAAP) | $ | 1,721 | $ | 2,928 | ||||
| (1) | ||||||||
| (2) Consists of business acquisition transaction expenses, severance and legal costs due to certain executive departures, and a | ||||||||
| (3) As we enter the next phase of our growth, we expect to invest in initiatives that are pre-revenue, including adding new products and international expansion. These development expenses are costs related to product exploration and development that are pre-revenue and historically have been insignificant. We view these activities as uses of our adjusted operating income separate from pet acquisition spend. | ||||||||
| The following tables reflect the reconciliation of GAAP measures to non-GAAP measures (in thousands, except percentages): | ||||||||
| Three Months Ended | ||||||||
| 2024 | 2023 | |||||||
| Subscription revenue | $ | 201,134 | $ | 165,210 | ||||
| Subscription cost of paying veterinary invoices | 151,493 | 128,149 | ||||||
| Subscription variable expenses | 19,407 | 16,655 | ||||||
| Subscription fixed expenses* | 10,642 | 7,795 | ||||||
| Subscription adjusted operating income (non-GAAP) | $ | 19,591 | $ | 12,610 | ||||
| Other business revenue | $ | 104,987 | $ | 91,119 | ||||
| Other business cost of paying veterinary invoices | 81,213 | 65,148 | ||||||
| Other business variable expenses | 16,498 | 18,743 | ||||||
| Other business fixed expenses* | 5,555 | 4,299 | ||||||
| Other business adjusted operating income (non-GAAP) | $ | 1,721 | $ | 2,928 | ||||
| Revenue | $ | 306,121 | $ | 256,329 | ||||
| Cost of paying veterinary invoices | 232,707 | 193,297 | ||||||
| Variable expenses | 35,905 | 35,399 | ||||||
| Fixed expenses* | 16,197 | 12,095 | ||||||
| Total business adjusted operating income (non-GAAP) | $ | 21,312 | $ | 15,538 | ||||
| As a percentage of revenue: | Three Months Ended | |||||||
| 2024 | 2023 | |||||||
| Subscription revenue | 100.0 | % | 100.0 | % | ||||
| Subscription cost of paying veterinary invoices | 75.3 | % | 77.6 | % | ||||
| Subscription variable expenses | 9.6 | % | 10.1 | % | ||||
| Subscription fixed expenses* | 5.3 | % | 4.7 | % | ||||
| Subscription adjusted operating income (non-GAAP) | 9.7 | % | 7.6 | % | ||||
| Other business revenue | 100.0 | % | 100.0 | % | ||||
| Other business cost of paying veterinary invoices | 77.4 | % | 71.5 | % | ||||
| Other business variable expenses | 15.7 | % | 20.6 | % | ||||
| Other business fixed expenses* | 5.3 | % | 4.7 | % | ||||
| Other business adjusted operating income (non-GAAP) | 1.6 | % | 3.2 | % | ||||
| Revenue | 100.0 | % | 100.0 | % | ||||
| Cost of paying veterinary invoices | 76.0 | % | 75.4 | % | ||||
| Variable expenses | 11.7 | % | 13.8 | % | ||||
| Fixed expenses* | 5.3 | % | 4.7 | % | ||||
| Total business adjusted operating income (non-GAAP) | 7.0 | % | 6.1 | % | ||||
| *Fixed expenses represent shared services that support both our subscription and other business segments and, as such, are generally allocated to each segment pro-rata based on revenues. | ||||||||
Adjusted operating income is a non-GAAP financial measure that adjusts operating income (loss) to remove the effect of acquisition cost, development expenses, non-recurring transaction or restructuring expenses, and gain (loss) from investment in joint venture. Non-cash items, such as stock-based compensation expense and depreciation and amortization, are also excluded. Acquisition cost, development expenses, gain (loss) from investment in joint venture, stock-based compensation expense, and depreciation and amortization are expected to remain recurring expenses for the foreseeable future, but are excluded from this metric to measure scale in other areas of the business. Management believes acquisition costs primarily represent the cost to acquire new subscribers and are driven by the amount of growth we choose to pursue based primarily on the amount of our adjusted operating income period over period. Accordingly, this measure is not indicative of our core operating income performance. We also exclude development expenses, gain (loss) from investment in joint venture, stock-based compensation expense, and depreciation and amortization because some investors may not view those items as reflective of our core operating income performance.
Management uses adjusted operating income and the margin on adjusted operating income to understand the effects of scale in its non-acquisition cost and development expenses and to plan future advertising expenditures, which are designed to acquire new pets. Management uses this measure as a principal way of understanding the operating performance of its business exclusive of acquisition cost and new product exploration and development initiatives. Management believes disclosure of this metric provides investors with the same data that the Company employs in assessing its overall operations and that disclosure of this measure may provide useful information regarding the efficiency of our utilization of revenues, return on advertising dollars in the form of new subscribers and future use of available cash to support the continued growth of our business.
| The following table reflects the reconciliation of adjusted EBITDA to net loss (in thousands): | |||||||||||||||||||||||||||||||
| Three Months Ended | |||||||||||||||||||||||||||||||
2024 | 2023 | 2023 | 2023 | 2023 | 2022 | 2022 | 2022 | ||||||||||||||||||||||||
| Net loss | $ | (6,852 | ) | $ | (2,163 | ) | $ | (4,036 | ) | $ | (13,714 | ) | $ | (24,780 | ) | $ | (9,285 | ) | $ | (12,914 | ) | $ | (13,618 | ) | |||||||
| Excluding: | |||||||||||||||||||||||||||||||
| Stock-based compensation expense | 7,398 | 6,636 | 6,585 | 6,503 | 12,140 | 8,412 | 8,306 | 8,462 | |||||||||||||||||||||||
| Depreciation and amortization expense | 3,785 | 3,029 | 2,990 | 3,253 | 3,202 | 2,897 | 2,600 | 2,707 | |||||||||||||||||||||||
| Interest income | (3,045 | ) | (2,842 | ) | (2,389 | ) | (2,051 | ) | (1,729 | ) | (1,614 | ) | (1,018 | ) | (297 | ) | |||||||||||||||
| Interest expense | 3,596 | 3,697 | 3,053 | 2,940 | 2,387 | 1,587 | 1,408 | 1,193 | |||||||||||||||||||||||
| Other non-operating expenses | — | — | — | — | — | — | — | (1 | ) | ||||||||||||||||||||||
| Income tax expense (benefit) | (38 | ) | 130 | (43 | ) | (238 | ) | (191 | ) | (15 | ) | 496 | 19 | ||||||||||||||||||
| Non-recurring transaction or restructuring expenses | — | — | 8 | 65 | 4,102 | 193 | 179 | — | |||||||||||||||||||||||
| (Gain) loss from equity method investment | — | — | (110 | ) | — | — | — | — | (131 | ) | |||||||||||||||||||||
| Adjusted EBITDA | $ | 4,844 | $ | 8,487 | $ | 6,058 | $ | (3,242 | ) | $ | (4,869 | ) | $ | 2,175 | $ | (943 | ) | $ | (1,666 | ) | |||||||||||
Contacts:
Investors:
Senior Vice President, Corporate Communications
Investor.Relations@trupanion.com
A photo accompanying this announcement is available at https://www.globenewswire.com/NewsRoom/AttachmentNg/98997a6f-abb9-4b5a-996b-c603837b7fca

![]()
Trupanion Reports First Quarter 2024 Results

Total Revenue by Quarter (dollars, in millions)
2024 GlobeNewswire, Inc., source


