(via TheNewswire)
 | |||||||||
KEY HIGHLIGHTS
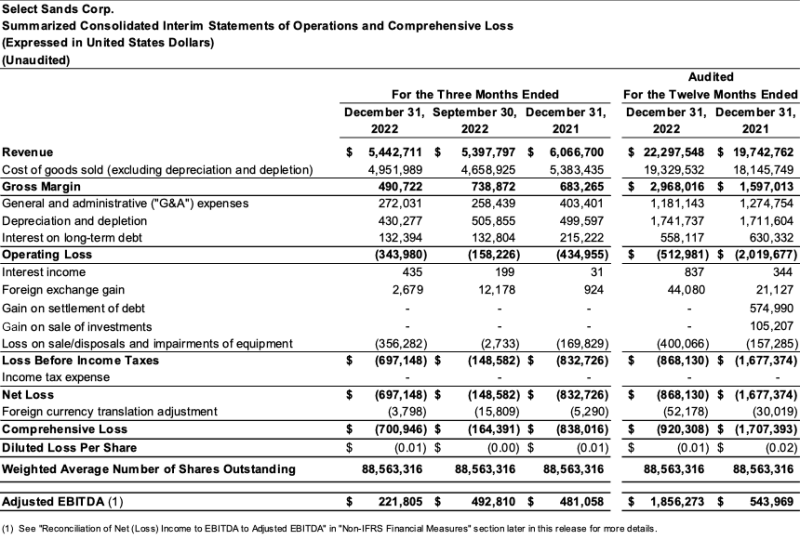
Sold 81,451 tons of frac and industrial sand during Q4 2022 compared to 83,222 tons in Q3 2022 and 94,670 tons in Q4 2021.
For full year 2022, the Company sold 355,307 tons of frac and industrial sand – an 8% increase from 328,978 tons sold during full year 2021.
Recorded revenue of
$5.4 million and gross margin of$0.5 million in Q4 2022 versus$5.4 million of revenue and gross margin of$0.7 million in Q3 2022, and revenue of$6.1 million and gross margin of$0.7 million for Q4 2021.For the twelve months ended
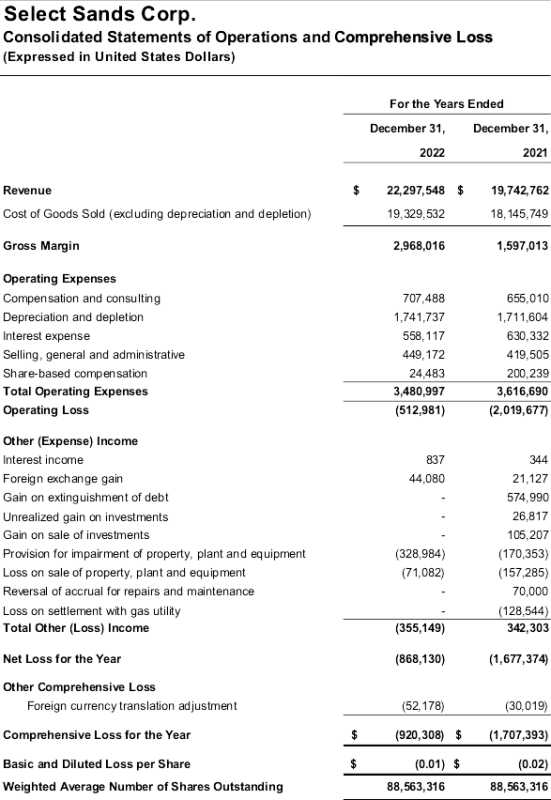
December 31, 2022 , the Company recorded revenue of$22.3 million and gross margin of$3.0 million – an increase of 13% and 86%, respectively, from revenue of$19.7 million and gross margin of$1.6 million for the twelve months endedDecember 31, 2021 .
Reported a net loss of
$0.7 million , or$0.01 per share, in Q4 2022 compared to a net loss of$0.1 million , or$0.00 per share, in Q3 2022 and a net loss of$0.8 million , or$0.01 per share, in Q4 2021.For full year 2022, the Company reported a net loss of
$0.9 million , or$0.01 per share, versus a net loss of$1.7 million , or$0.02 per share, for full year 2021.
Generated adjusted EBITDA(1) of
$0.2 million for Q4 2022 versus$0.5 million in Q3 2022 and$0.5 million for Q4 2021.For the twelve months ended
December 31, 2022 , the Company generated adjusted EBITDA of$1.9 million – 3.4 times higher than the$0.5 million of adjusted EBITDA generated during the twelve months endedDecember 31, 2021 .
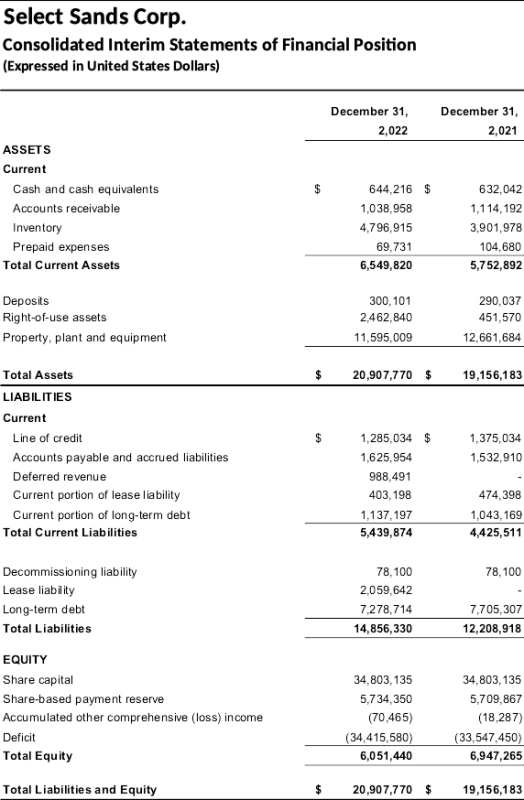
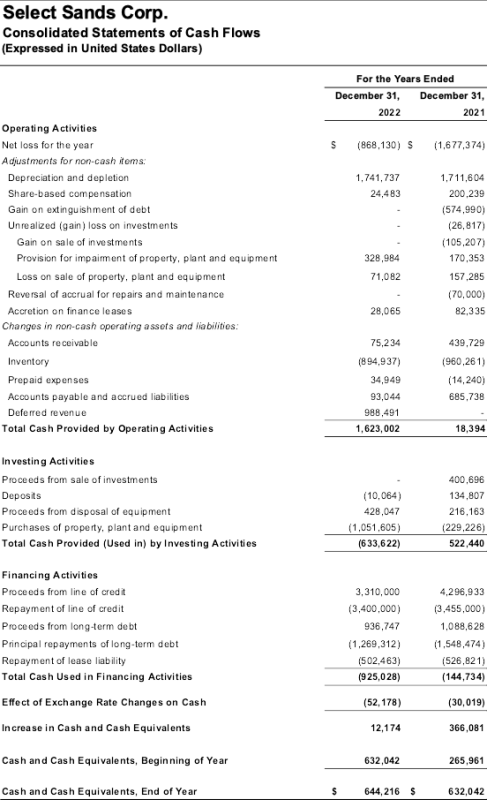
As of
December 31, 2022 , cash and cash equivalents were$0.6 million , accounts receivable was$1.0 million , inventory was$4.8 million , working capital was$1.1 million and total debt was$8.4 million (including$7.3 million long-term).
Adjusted EBITDA is a non-IFRS financial measure and is described and reconciled to net (loss) income in the table later in this release under the section titled “Non-IFRS Financial Measures”.
FINANCIAL SUMMARY
The following table includes summarized financial results for the three months ended
Click Image To View Full Size
SALES VOLUMES
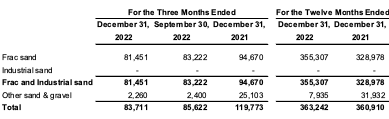
For Q1 2023, the Company expects frac and industrial sand sales volumes of approximately 83,000 tons.
OPERATIONS UPDATE
Contributing to Select Sands’ positive outlook is Baker Hughes’ recently published weekly drilling rig count estimates that show a
OUTLOOK
ADDITIONAL MANAGEMENT COMMENTARY
An audio recording of management’s additional comments related to its results and outlook will be posted to the Company’s website (https://www.selectsands.com/) under the Investors section before the market opens
ABOUT
FORWARD-LOOKING STATEMENTS
This news release includes forward-looking information and statements, which may include, but are not limited to, information and statements regarding or inferring the future business, operations, financial performance, prospects, and other plans, intentions, expectations, estimates, and beliefs of the Company. Information and statements which are not purely historical fact are forward-looking statements. The forward-looking statements in this press release relate to comments that include, but are not limited to, statements related to expected current and future state of operations, sales volumes for 2023, customer activity levels, and the unique market position of the Company. Forward-looking information and statements involve and aresubject to assumptions and known and unknown risks, uncertainties, and other factors which may cause actual events, results, performance, or achievements of the Company to be materially different from future events, results, performance, and achievements expressed or implied by forward-looking information and statements herein. Although the Company believes that any forward-looking information and statements herein are reasonable, in light of the use of assumptions and the significant risks and uncertainties inherent in such information and statements, there can be no assurance that any such forward-looking information and statements will prove to be accurate, and accordingly readers are advised to rely on their own evaluation of such risks and uncertainties and should not place undue reliance upon such forward-looking information and statements. Any forward-looking information and statements herein are made as of the date hereof, and except as required by applicable laws, the Company assumes no obligation and disclaims any intention to update or revise any forward-looking information and statements herein or to update the reasons that actual events or results could or do differ from those projected in any forward-looking information and statements herein, whether as a result of new information, future events or results, or otherwise, except as required by applicable laws.
COMPANY CONTACTS
Please visitwww.selectsands.com or contact:
President & CEO Phone 844-806-7313 | W. Joe O’Rourke Vice President Sales & Marketing Phone: (713) 689-8000 Joe.orourke@selectsands.com |
Neither
Click Image To View Full Size
Click Image To View Full Size
Click Image To View Full Size
NON-IFRS FINANCIAL MEASURES
The following information is included for convenience only. Generally, a non-IFRS financial measure is a numerical measure of a company’s performance, cash flows or financial position that either excludes or includes amounts that are not normally excluded or included in the most directly comparable measure calculated and presented in accordance with IFRS. Adjusted EBITDA is not a measure of financial performance (nor does it have a standardized meaning) under IFRS. In evaluating non-IFRS financial measures, investors should consider that the methodology applied in calculating such measures may differ among companies and analysts.
The Company uses both IFRS and certain non-IFRS measures to assess operational performance and as a component of employee remuneration. Management believes certain non-IFRS measures provide useful supplemental information to investors in order that they may evaluate
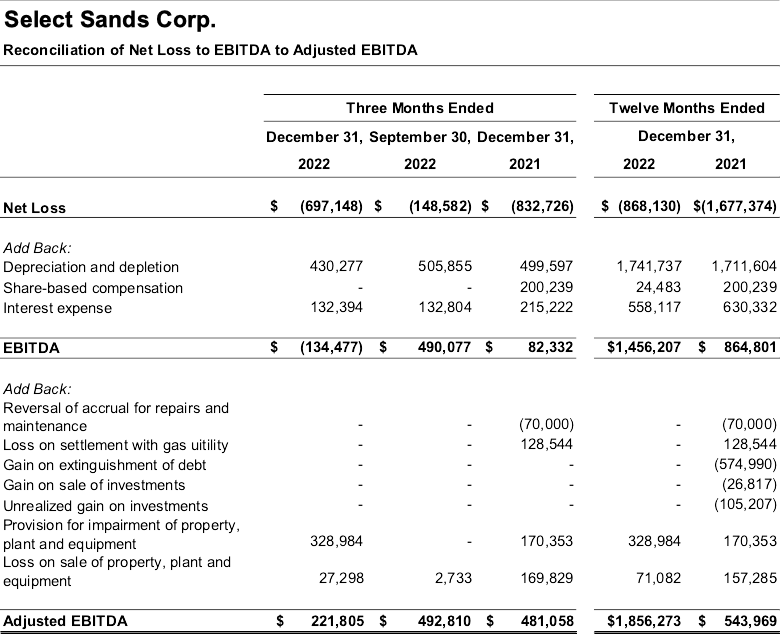
As reflected in the above tables for the periods presented, the Company defines EBITDA as net loss adjusted for items listed. The Company defines Adjusted EBITDA as net loss adjusted for select items used to estimate EBITDA with additional adjustments as listed in the above table to estimate Adjusted EBITDA.
INDICATED RESOURCES DISCLOSURE
The Company advises that the production decision on the Sandtown deposit (the Company’s current “Sand Operations”) was not based on a Feasibility Study of mineral reserves, demonstrating economic and technical viability, and, as a result, there may be an increased uncertainty of achieving any level of recovery of minerals or the cost of such recovery, including increased risks associated with developing a commercially mineable deposit. Historically, such projects have a much higher risk of economic and technical failure. There is no guarantee that production will occur as anticipated or that anticipated production costs will be achieved.
Copyright (c) 2023 TheNewswire - All rights reserved.
Copyright (c) 2023 TheNewswire - All rights reserved., source


