“During a recent trip to
It was very refreshing to meet a head of state who is an engaging communicator with plans based on sound economic principles designed to unburden the economy and get
Today there exists an infectious optimism about
At Los Azules, we had 22 drills operating this season and we succeeded in drilling over 69,000 meters to date, an impressive achievement, putting us on track to deliver our final feasibility report in Q1 2025.
During Q1 our Gold Bar mine performed well achieving a low production cost/oz due to the mine sequence being light on waste movements, the
Financial Results
Our gross profit in Q1 was
Adjusted EBITDA(1) was
We reported a consolidated net loss of
Liquidity and Capital Resources
We reported consolidated cash and cash equivalents of
Gold & Silver Production (See Table 1)
Consolidated production from our three operating mines was 32,725 gold equivalent ounces (GEOs)(3) in Q1, compared to 30,400 GEOs in Q1 2023. The average realized price of sales during Q1 was
Individual Mine Performance:
At Gold Bar, we produced 11,716 GEOs, an increase of 82% compared to Q1 2023, when production was adversely impacted by major flooding. The Gold Bar mine guidance is 40,000 to 43,000 GEOs for full year 2024.
Cash costs and AISC per GEO sold for the Gold Bar mine in Q1 were
At Fox, production was below plan at 7,486 GEOs, due to lower than expected mined grades. As a result of the lower mined and stockpile grades, our cash costs(2) and AISC per GEO(2) sold for Fox in Q1 were
Subsequent to quarter end we have begun to see higher grades of gold production and we reiterate production cost/oz guidance at Fox of 40,000 to 42,000 GEOs for the full year 2024.
San José Mine (49% owned)
At San José, Q1 production increased by 15% compared to Q1 2023 due to an improvement in average grade processed. San José produced 12,934 attributable GEOs during Q1, exceeding their year-to-date plan. The next three quarters in 2024 are expected to achieve higher production. We reiterate full year guidance of 50,000 to 60,000 attributable GEOs.
Cash costs and AISC per GEO sold for San José in Q1 were
San José Exploration
Near mine exploration drilling is being conducted underground at the Frea, Odin, and Remal N. veins. Recently, hole SJM-663 was drilled along the southeast extension of the Frea vein and hit 12 m of 12.7 g/t Au and 101 g/t Ag at a lower elevation within the vein. This has opened a new area for additional exploration, which is underway with 260-foot (80-meter) step-outs and the potential to extend over 2,300 ft. (700 m).
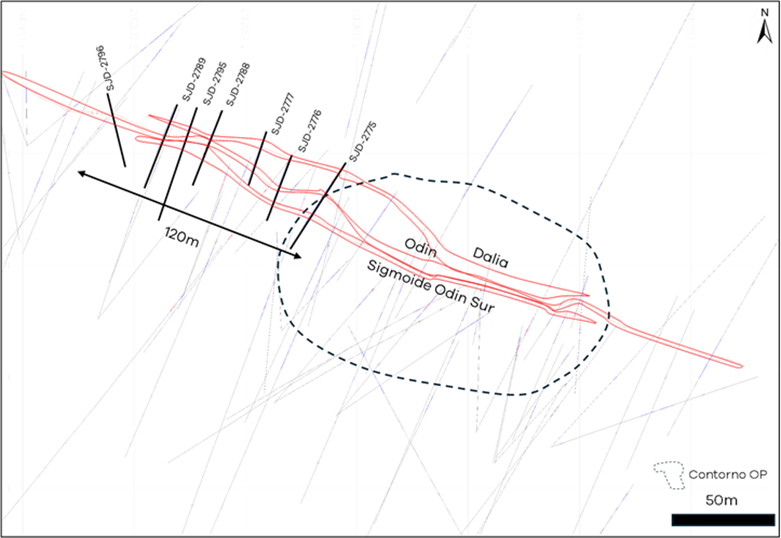
An open pit was constructed along the southeast portion of the Odin vein (“Contorno OP”) in an area where high grade mineralization was close to the surface. Mining from the Contorno OP was successful, therefore shallow drilling has been carried out 400 ft (120 m) along strike through a sequence of veins called Dalia, Odin, and Sigmoide Odin Sur (“SOS”) to determine if the pit can be extended, with some encouraging results summarized below (see Figure 1):
| Hole ID | Vein | Assay Result |
| SJD-2775 | Dalia | 2.8 m of 1.1 g/t Au and 221 g/t Ag |
| Odin | 1.0 m of 1.9 g/t Au and 216 g/t Ag | |
| SOS | 1.5 m of 1.8 g/t Au and 166 g/t Ag | |
| SJD-2776 | Dalia | 2.6 m of 2.0 g/t Au and 513 g/t Ag |
| Odin | 1.3 m of 0.4 g/t Au and 12 g/t Ag | |
| SOS | 0.9 m of 0.1 g/t Au and 13 g/t Ag | |
| SJD-2777 | Dalia | 3.5 m of 1.3 g/t Au and 86 g/t Ag |
| Odin | 2.3 m of 5.5 g/t Au and 70 g/t Ag | |
| SOS | 0.9 m of 0.2 g/t Au and 43 g/t Ag | |
| SJD-2778 | Dalia | 1.7 m of 0.5 g/t Au and 19 g/t Ag |
| Odin | 1.4 m of 0.3 g/t Au and 54 g/t Ag | |
| SOS | 1.0 m of 1.4 g/t Au and 70 g/t Ag | |
| SJD-2788 | Dalia | 1.5 m of 4.8 g/t Au and 51 g/t Ag |
| Odin | 2.7 m of 7.6 g/t Au and 360 g/t Ag | |
| SOS | 6.2 m of 23.3 g/t Au and 314 g/t Ag | |
| SJD-2789 | Dalia | 0.9 m of 1.4 g/t Au and 125 g/t Ag |
| Odin | 1.6 m of 3.2 g/t Au and 287 g/t Ag | |
| SOS | 1.5 m of 3.5 g/t Au and 281 g/t Ag | |
| SJD-2795 | Dalia | 0.9 m of 0.6 g/t Au and 90 g/t Ag |
| Odin | 1.7 m of 2.8 g/t Au and 137 g/t Ag | |
| SOS | 4.7 m of 2.6 g/t Au and 60 g/t Ag | |
Exploration programs were also conducted to the south of the San José mine adjacent to Newmont’s
Figure 1: Plan map of near surface veins and Contorno open pit
The Los Azules project is one of the world’s largest undeveloped copper porphyry copper deposits. From its creation in 2021 to the end of Q1 2024,
Key highlights of our Q1 and recent activities at Los Azules:
Drilling Program
Our 2023-2024 drilling program began in
2023-2024 Preliminary Assay Results
Preliminary assay results from the 2023-2024 drilling season have been received and analyzed. These assay results include significant copper values over wide intercepts that generally correspond well with the resource block model used in the
- 257 m of 0.76% Cu, in the Enriched zone (Hole AZ23205)
- 446 m of 0.63% Cu, including 76 m of 0.92% Cu (Hole AZ23228)
- 250 m of 0.68% Cu, in the Enriched zone, including 192 m of 0.83% Cu (Hole AZ23230)
Further details on our assay results were released in our press release dated
Improved Copper Recovery
Copper heap leaching metallurgical tests conducted at SGS Chile Limitada in
Environmental Impact Assessment
The first presentation of the Environmental Impact Assessment to the
Timberline Acquisition
On
- Strengthen its core portfolio of projects in
Nevada , a very favorable mining jurisdiction; - Acquire gold resources at a low per-ounce cost, with the potential to contribute to McEwen’s gold production growth within 2 to 5 years depending on the mining scenario;
- Grow our portfolio of prospective exploration targets, including deep sulfide gold targets and poly-metallic base metal targets;
- Realize synergies between Timberline’s projects and the Company’s Gold Bar mine, including common technical personnel, procurement functions, shared mine infrastructure, synergies in recruiting and human resources in the region around
Eureka, Nevada .
Management Conference Call
Management will discuss our Q1 financial results and project developments and follow with a question and answer session. Questions can be asked directly by participants over the phone during the webcast.
| Thursday, | (888) 210-3454 | |
| Toll Free Dial-In Other Countries: | https://events.q4irportal.com/custom/access/2324/ | |
| Toll Dial-In: | (646) 960-0130 | |
| Conference ID Number: | 3232920 | |
| Webcast Link: | https://events.q4inc.com/attendee/871742148 | |
An archived replay of the webcast will be available approximately 2 hours following the conclusion of the live event. Access the replay on the Company’s media page at https://www.mcewenmining.com/media.
Table 1 below provides production and cost results for Q1, with comparative results from Q1 2023 and our guidance range for 2024.
| Q1 | Full Year 2024 | |||
| 2023 | 2024 | |||
| Consolidated Production | ||||
| GEOs(2) | 30,400 | 32,750(4) | 130,000-145,000 | |
| GEOs | 6,500 | 11,700 | 40,000-43,000 | |
| Cash Costs/GEO(1) | $1,088 | |||
| AISC/GEO(1) | $1,201 | |||
| GEOs | 12,700 | 7,500 | 40,000-42,000 | |
| Cash Costs/GEO | $1,555 | |||
| AISC/GEO | $1,928 | |||
| Total Gold Bar + Fox | ||||
| GEOs | 19,200 | 19,200 | ||
| Cash Costs/GEO | $1,268 | |||
| AISC/GEO | $1,481 | |||
| San José Mine, | ||||
| GEOs | 11,200 | 12,950 | 50,000-60,000 | |
| Cash Costs/GEO | $1,607 | |||
| AISC/GEO | $1,947 | |||
Notes:
- Cash gross profit, cash costs per ounce, all-in sustaining costs (AISC) per ounce, and adjusted EBITDA and adjusted EBITDA per share are non-GAAP financial performance measures with no standardized definition under
U.S. GAAP. For definition of the non-GAAP measures see "Non-GAAP- Financial Measures" section in this press release; for the reconciliation of the non-GAAP measures to the closestU.S. GAAP measures, see the Management Discussion and Analysis for the quarter endedMarch 31, 2023 , filed on Edgar and SEDAR. - 'Gold Equivalent Ounces' are calculated based on a gold to silver price ratio of 84:1 for Q1 2023 and 89:1 for Q1 2024. 2024 production guidance is calculated based on 85:1 gold to silver price ratio.
- Represents the portion attributable to us from our 49% interest in the San José Mine.
- Includes 600 oz Au from
El Gallo pond cleanout that was paid in Q1 2024.
Technical Information
The technical content of this news release related to financial results, mining and development projects has been reviewed and approved by
Reliability of Information Regarding San José
CAUTIONARY NOTE REGARDING NON-GAAP MEASURES
In this release, we have provided information prepared or calculated according to United States Generally Accepted Accounting Principles (“U.S. GAAP”), as well as provided some non-
Cash Costs and All-in Sustaining Costs
Cash costs consist of mining, processing, on-site general and administrative costs, community and permitting costs related to current operations, royalty costs, refining and treatment charges (for both doré and concentrate products), sales costs, export taxes and operational stripping costs, and exclude depreciation and amortization. All-in sustaining costs consist of cash costs (as described above), plus accretion of retirement obligations and amortization of the asset retirement costs related to operating sites, sustaining exploration and development costs, sustaining capital expenditures, and sustaining lease payments. Both cash costs and all-in sustaining costs are divided by the gold equivalent ounces sold to determine cash costs and all-in sustaining costs on a per ounce basis. We use and report these measures to provide additional information regarding operational efficiencies on an individual mine basis, and believe that these measures provide investors and analysts with useful information about our underlying costs of operations. A reconciliation to production costs applicable to sales, the nearest
| Three months ended | |||||||||
| Gold Bar | Total | ||||||||
| (in thousands, except per ounce) | |||||||||
| Production costs applicable to sales - Cash costs (100% owned) | $ | 13,268 | $ | 11,842 | $ | 25,110 | |||
| In‑mine exploration | 799 | — | 799 | ||||||
| Capitalized underground mine development (sustaining) | — | 2,302 | 2,302 | ||||||
| Capital expenditures on plant and equipment (sustaining) | 551 | — | 551 | ||||||
| Sustaining leases | 21 | 539 | 560 | ||||||
| All‑in sustaining costs | $ | 14,639 | $ | 14,683 | $ | 29,322 | |||
| Ounces sold, including stream (GEO) | 12.2 | 7.6 | 19.8 | ||||||
| Cash cost per ounce sold ($/GEO) | $ | 1,088 | $ | 1,555 | $ | 1,268 | |||
| AISC per ounce sold ($/GEO) | $ | 1,201 | $ | 1,928 | $ | 1,481 | |||
| Three months ended | |||||||||
| Gold Bar | Total | ||||||||
| (in thousands, except per ounce) | |||||||||
| Production costs applicable to sales - Cash costs (100% owned) | $ | 9,341 | $ | 14,072 | $ | 23,413 | |||
| Mine site reclamation, accretion and amortization | — | — | — | ||||||
| In‑mine exploration | 482 | — | 482 | ||||||
| Capitalized underground mine development (sustaining) | — | 2,655 | 2,655 | ||||||
| Capital expenditures on plant and equipment (sustaining) | 693 | — | 693 | ||||||
| Sustaining leases | 289 | 222 | 511 | ||||||
| All‑in sustaining costs | $ | 10,805 | $ | 16,949 | $ | 27,754 | |||
| Ounces sold, including stream (GEO) | 6.3 | 12.9 | 19.2 | ||||||
| Cash cost per ounce sold ($/GEO) | $ | 1,491 | $ | 1,088 | $ | 1,220 | |||
| AISC per ounce sold ($/GEO) | $ | 1,725 | $ | 1,311 | $ | 1,446 | |||
| Three months ended | ||||||||
| 2024 | 2023 | |||||||
| San José mine cash costs (100% basis) | (in thousands, except per ounce) | |||||||
| Production costs applicable to sales - Cash costs | $ | 47,884 | $ | 41,124 | ||||
| Mine site reclamation, accretion and amortization | 304 | 292 | ||||||
| Site exploration expenses | 2,104 | 1,952 | ||||||
| Capitalized underground mine development (sustaining) | 7,331 | 7,130 | ||||||
| Less: Depreciation | (799 | ) | (550 | ) | ||||
| Capital expenditures (sustaining) | 1,200 | 1,089 | ||||||
| All‑in sustaining costs | $ | 58,024 | $ | 51,036 | ||||
| Ounces sold (GEO) | 29.8 | 22.8 | ||||||
| Cash cost per ounce sold ($/GEO) | $ | 1,607 | $ | 1,800 | ||||
| AISC per ounce sold ($/GEO) | $ | 1,947 | $ | 2,234 | ||||
Cash Gross Profit
Cash gross profit is a non-GAAP financial measure and does not have any standardized meaning. We use cash gross profit to evaluate our operating performance and ability to generate cash flow; we disclose cash gross profit as we believe this measure provides valuable assistance to investors and analysts in evaluating our ability to finance our ongoing business and capital activities. The most directly comparable measure prepared in accordance with GAAP is gross profit. Cash gross profit is calculated by adding depletion and depreciation to gross profit. A reconciliation to gross profit, the nearest
Adjusted EBITDA and adjusted EBITDA per share
Adjusted earnings before interest, taxes, depreciation, and amortization (“Adjusted EBITDA”) is a non-GAAP financial measure and does not have any standardized meaning. We use adjusted EBITDA to evaluate our operating performance and ability to generate cash flow from our wholly owned operations in production; we disclose this metric as we believe this measure provides valuable assistance to investors and analysts in evaluating our ability to finance our precious metal operations and capital activities separately from our copper exploration operations. The most directly comparable measure prepared in accordance with GAAP is net loss before income and mining taxes. Adjusted EBITDA is calculated by adding back
| Three months ended | ||||||||
| 2024 | 2023 | |||||||
| Adjusted EBITDA | (in thousands) | |||||||
| Net loss before income and mining taxes | $ | (22,940 | ) | $ | (36,946 | ) | ||
| Less: | ||||||||
| Depreciation and depletion | 10,278 | 7,178 | ||||||
| Loss from investment in | 18,012 | — | ||||||
| Advanced Projects – | — | 31,880 | ||||||
| General, interest and other – | — | (6,313 | ) | |||||
| Interest expense | 972 | 1,347 | ||||||
| Adjusted EBITDA | $ | 6,322 | $ | (2,854 | ) | |||
| Weighted average shares outstanding (thousands) | 49,440 | 47,428 | ||||||
| Adjusted EBITDA per share | $ | 0.13 | $ | (0.06 | ) | |||
CAUTION CONCERNING FORWARD-LOOKING STATEMENTS
This news release contains certain forward-looking statements and information, including "forward-looking statements" within the meaning of the Private Securities Litigation Reform Act of 1995. The forward-looking statements and information expressed, as at the date of this news release,
The NYSE and TSX have not reviewed and do not accept responsibility for the adequacy or accuracy of the contents of this news release, which has been prepared by management of
ABOUT
Want News Fast?
Subscribe to our email list by clicking here:
https://www.mcewenmining.com/contact-us/#section=followUs
and receive news as it happens!
| WEB SITE | SOCIAL MEDIA | |||||
| www.mcewenmining.com | McEwen Mining | Facebook: | facebook.com/mcewenmining | |||
| LinkedIn: | linkedin.com/company/mcewen-mining-inc- | |||||
| CONTACT INFORMATION | Twitter: | twitter.com/mcewenmining | ||||
| Instagram: | instagram.com/mcewenmining | |||||
| Suite 2800, PO Box 24 | ||||||
| McEwen Copper | Facebook: | facebook.com/mcewencopper | ||||
| M5H 1J9 | LinkedIn: | linkedin.com/company/mcewencopper | ||||
| Twitter: | twitter.com/mcewencopper | |||||
| Relationship with Investors: | Instagram: | instagram.com/mcewencopper | ||||
| (866)-441-0690 - Toll free line | ||||||
| (647)-258-0395 | Facebook: | facebook.com/mcewenrob | ||||
| LinkedIn: | linkedin.com/in/robert-mcewen-646ab24 | |||||
| info@mcewenmining.com | Twitter: | twitter.com/robmcewenmux | ||||
A photo accompanying this announcement is available at https://www.globenewswire.com/NewsRoom/AttachmentNg/7d3034fe-b5be-4eca-9d65-969482935464

![]()
Figure 1:
Plan map of near surface veins and Contorno open pit
2024 GlobeNewswire, Inc., source

