(via TheNewswire)
 | |||||||||
 |  |  |  | ||||||
Highlights:
Laboratory ICP checks show XRF soil geochemistry data is conservative and reliable.
Test grids highlighted copper anomalies in Au-Cu-Ag epithermal system.
Geochemical soil survey using a bench-mounted XRF analyser is a low-cost, time-efficient exploration tool.
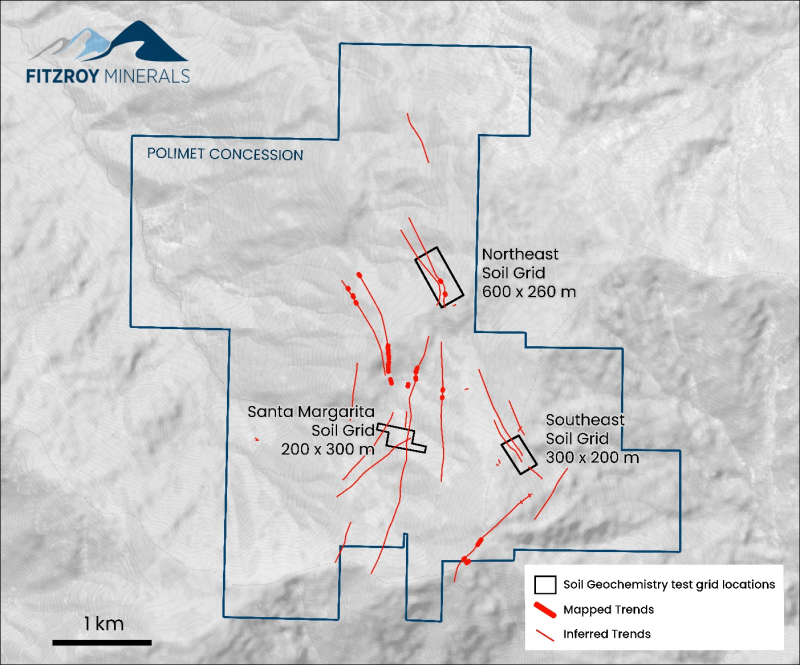
A geochemical soil survey was completed by the Project vendor at the
Figure 1. Polimet concession and soil geochemistry test-grid location map. |
|
Sample Preparation and XRF Process
Rigorous QA/QC procedures were followed during sample collection and preparation.The survey team used trowels and bags when sampling, cleaning the equipment between sample collection. For each sample, the location, date, time, depth, and other relevant information was recorded. For each sample a photograph was taken showing the GPS coordinates, the bagged sample, and the sample site.
In the sample preparation procedure, the following steps were taken:
Log and record Sample ID.
Assess to see if sample is wet or dry.
Dry any wet samples by placing individually in a stainless-steel tray in an oven. Return dried sample to sample bag.
Weigh dry sample.
Gently roll and check bagged samples to ensure soil lumps are broken down.
Transfer the sample to a stainless-steel tray.
Pass the sample through a clean Riffle Splitter that feeds into two clean stainless-steel trays.
Return the contents of one of the two trays to the sample bag. Pass the other tray through the Riffle Splitter again. Return the ¼ sample to the original sample bag and add the other ¼ sample to a new bag.
Weigh the ¼ soil sample.
Add the ¼ sample to the vibrating screens and separate the size fractions, recording the time required to separate.
Take multiple readings of the fine-fraction (80#) using the XRF analyser, recording the average.
Carry out regular calibration checks of the XRF analyser using known reference materials.
XRF Analyser versus Laboratory ICP Results
A representative suite of low-, medium-, and high-grade soil samples were selected for check-assay by ICP and Fire Assay at Andes Analytical Assay SpA (
Table 1. Summary comparison between results collected by XRF Analyser and Laboratory ICP.
Cu (ppm) | Mn (ppm) | Zn (ppm) | |||||||
Sample ID | ICP | XRF | Var | ICP | XRF | Var | ICP | XRF | Var |
SM LT 100-150 | 624 | 508 | -19% | >2000 | 2,098 | 509 | 403 | -21% | |
SM LT 000-075 | 1356 | 967 | -29% | 1336 | 1,157 | -13% | 165 | 159 | -4% |
SM LT 050-150 | 239 | 214 | -10% | 1984 | 1,798 | -9% | 150 | 165 | 10% |
SM LT 100-050 | 108 | 102 | -5% | 1333 | 1,380 | 4% | 133 | 141 | 6% |
SM LT 150-000 | 73 | 71 | -2% | 1564 | 1,511 | -3% | 133 | 148 | 11% |
NE LT 00-050 | 73 | 75 | 2% | >2000 | 2325 | 154 | 173 | 12% | |
NE LT 050-050 | 173 | 160 | -7% | >2000 | 2517 | 172 | 235 | 37% | |
NE LT 100-100 | 220 | 200 | -9% | 1986 | 1786 | -10% | 167 | 187 | 12% |
NE LT 150-175 | 59 | 59 | 0% | 1602 | 1460 | -9% | 95 | 143 | 51% |
NE LT 250-125 | 1989 | 1,741 | -12% | 1958 | 1661 | -15% | 228 | 275 | 21% |
NE LT 350-050 | 185 | 110 | -40% | 1728 | 1178 | -32% | 176 | 99 | -44% |
NE LT 450-125 | 80 | 92 | 15% | >2000 | 1734 | 169 | 207 | 22% | |
NE LT 550-125 | 181 | 162 | -10% | 1843 | 1790 | -3% | 137 | 136 | -1% |
SE LT 000-175 | 197 | 196 | -1% | >2000 | 2322 | 181 | 182 | 1% | |
SE LT 050-050 | 87 | 90 | 3% | 1192 | 1334 | 12% | 83 | 115 | 39% |
SE LT 100-250 | 44 | 55 | 26% | 1552 | 1459 | -6% | 101 | 116 | 15% |
SE LT 150-150 | 1759 | 1579 | -10% | >2000 | 2835 | 591 | 555 | -6% | |
SE LT 200-100 | 356 | 337 | -5% | >2000 | 1944 | 147 | 164 | 12% | |
SE LT 250-000 | 151 | 99 | -34% | 1158 | 996 | -14% | 90 | 65 | -28% |
SE LT 350-175 | 73 | 70 | -4% | 1040 | 1064 | 2% | 98 | 113 | 15% |
Average: | 401 | 344 | -8% | 1,560 | 1,717 | -7% | 184 | 189 | 8% |
Table 1 provides the ICP results from the 20 check soil samples, the original XRF results, and the variance between the ICP and XRF soil sample results. The sample numbers identify the soil grid, the line number, and the distance along that line. The key observation is that the copper and manganese results are slightly under-reported using the XRF analyser, and that zinc is slightly over-reported by XRF.
Using these ICP results, further calibration can be made to the XRF analyser to further reduce variance in results. Fitzroy Minerals will continue to carry out check assays and ongoing calibration of the XRF analyser.
Soil Anomalies
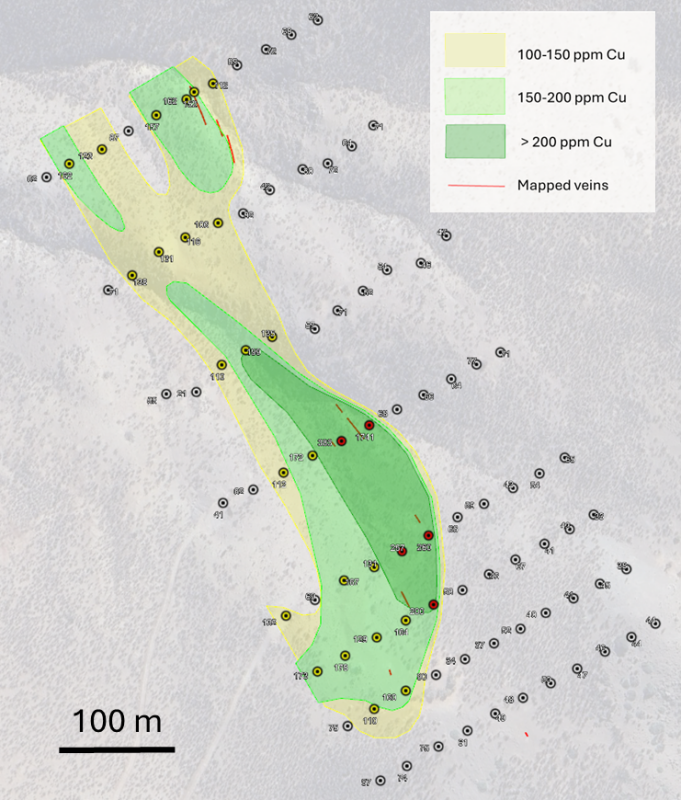
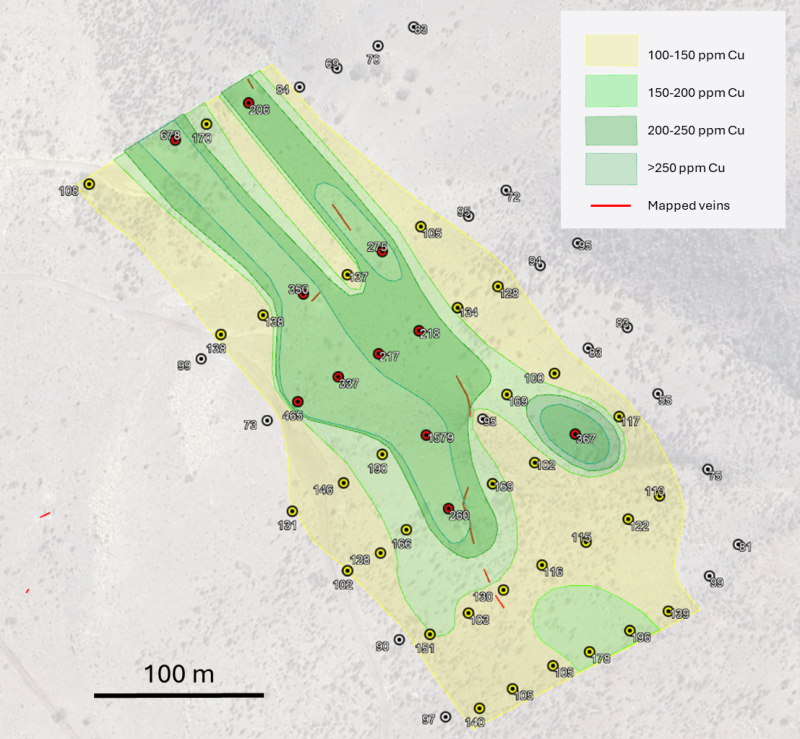
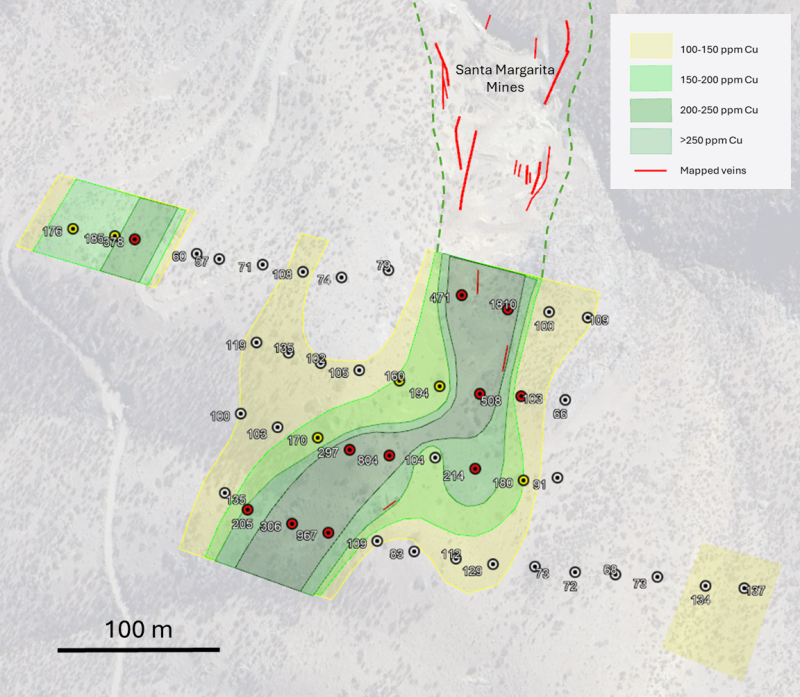
Figures 2 to 4 below,, show that a geochemical soil anomaly with a threshold of 200 ppm broadly align with the mapped epithermal vein occurrences. Subtle features such as a flexure in the anomalies in Figures 1 and 2 emerge. Note also that Figure 4 shows that the Santa Margarita soil survey may have picked up a parallel structure that does not have a surface expression.
The maximum copper concentrations in each of the three survey areas are 1741 ppm Cu (Northeast), 1810 ppm Cu (
Figure 2. Northeast geochemical soil survey grid. |
|
Fitzroy Minerals sees significant time and cost advantages of continuing to use these established XRF geochemical soil survey methods. The maps show that the method works well. Importantly, mineralization at Polimet is expected to be best developed at elevations between 1,000 metres and 1,600 metres above sea level and concentrated in high-grade pay-shoots. Pay-shoots in the epithermal mineralization of the
Figure 3. Southeast geochemical soil survey grid. |
|
In combination with geophysics and geology, Fitzroy Minerals will develop drilling targets over the coming months. The planned geophysical program may include a selection of induced polarisation, spectral analysis, and magnetometry surveys. In terms of geology, the focus will be detailed structural mapping. The combined results of the structural mapping, the soil geochemistry, and the geophysics will guide the drilling program at Polimet later in the year. Given the infrastructure benefits of Polimet over Caballos and the fact that
Figure 4. |
|
Qualified Person
Dr.
About Fitzroy Minerals
Fitzroy Minerals is focused on exploring and developing mineral assets with substantial upside potential in the
On behalf of
President and CEO
For further information, please contact:
mmj@fitzroyminerals.com
+1 604-505-4554
For more information on Fitzroy Minerals, please visit the Company's website:www.fitzroyminerals.com
This press release does not constitute an offer to sell or a solicitation of an offer to buy any of the securities in
Neither Exchange nor its Regulation Services Provider (as that term is defined in the policies of the Exchange) accepts responsibility for the adequacy or accuracy of this release.
CAUTIONARY STATEMENT REGARDING FORWARD-LOOKING INFORMATION
This news release includes certain statements and information that constitute forward-looking information within the meaning of applicable Canadian securities laws. All statements in this news release, other than statements of historical facts are forward-looking statements. Such forward-looking statements and forward-looking information specifically include, but are not limited to, statements that relate to the completion of the Offering and the timing and pricing in respect thereof, the use of proceeds of the Offering, and timely receipt of all necessary approvals, including any requisite approval of the Exchange.
Statements contained in this release that are not historical facts are forward-looking statements that involve various risks and uncertainty affecting the business of the Company. Such statements can generally, but not always, be identified by words such as "expects", "plans", "anticipates", "intends", "estimates", "forecasts", "schedules", "prepares", "potential" and similar expressions, or that events or conditions "will", "would", "may", "could" or "should" occur. All statements that describe the Company's plans relating to operations and potential strategic opportunities are forward-looking statements under applicable securities laws. These statements address future events and conditions and are reliant on assumptions made by the Company's management, and so involve inherent risks and uncertainties, as disclosed in the Company's periodic filings with Canadian securities regulators. As a result of these risks and uncertainties, and the assumptions underlying the forward-looking information, actual results could materially differ from those currently projected, and there is no representation by the Company that the actual results realized in the future will be the same in whole or in part as those presented herein. theCompany disclaims any intent or obligation to update forward-looking statements or information except as required by law. Readers are referred to the additional information regarding the Company's business contained in the Company's reports filed with the securities regulatory authorities in Canada. Although the Company has attempted to identify important factors that could cause actual actions, events, or results to differ materially from those described in forward-looking statements, there may be other factors that could cause actions, events or results not to be as anticipated, estimated or intended. For more information on the Company and the risks and challenges of its business, investors should review the Company's filings that are available at www.sedar.com.
The Company provides no assurance that forward-looking statements and information will prove to be accurate, as actual results and future events could differ materially from those anticipated in such statements or information. Accordingly, readers should not place undue reliance on forward-looking statements or information. The Company does not undertake to update any for-ward looking statements, other than as required by law.
Copyright (c) 2024 TheNewswire - All rights reserved.
Copyright (c) 2024 TheNewswire - All rights reserved., source


