The 2023 Study has been updated to reflect the current costing environment, as well as a significant amount of additional engineering, on-site geotechnical investigation work, and requirements outlined during the permitting process with the Environmental Impact Statement ("EIS”) granted in
2023 Study Highlights:
Higher production: average annual gold production of 207,000 ounces over the first five years and 176,000 ounces over the initial 10 years
- The 10-year average represents a 23% increase over the annual average of 143,000 ounces in the 2017 Study
Low-cost profile: average mine-site all-in sustaining costs of
- Average mine-site all-in sustaining costs decreased 6% from the 2017 Study over the initial 10-years with economies of scale provided by the larger operation, and higher average grades, more than offsetting cost inflation
Larger, longer-life operation supported by 44% larger Mineral Reserve with further upside potential
- 44% larger Mineral Reserve totaling 2.3 million ounces grading 1.52 grams per tonne of gold (“g/t Au”) (47.6 million tonnes (“mt”))
- 17-year mine life, up from 10 years in the 2017 Study
- Life of mine production of 2.2 million ounces, a 46% increase from 1.5 million ounces reported in 2017
Modest increase in capital intensity with larger operation and 46% increase in life of mine production partly offsetting inflation
- Initial capital of
$632 million , and life of mine capital including sustaining capital and reclamation of$832 million , increased from the 2017 Study reflecting inflation and scope changes with the larger operation and Mineral Reserve - Total life of mine capital of
$381 per ounce increased 17% from$325 per ounce in the 2017 Study with the larger Mineral Reserve and economies of scale partly offsetting the significant industry-wide capital inflation experienced since 2017
Project de-risked given advanced level of engineering, additional geotechnical work, and EIS approval
- Detailed engineering 55% complete; basic engineering 100% complete
- EIS approval and Provincial licenses received in
March 2023 with requirements outlined through the permitting process incorporated into the 2023 Study - Extensive geotechnical drilling, test pits, and ground penetrating radar employed across the project area including the mill, open pits and tailings locations providing higher degree of confidence around required earthworks, tailings design and mine plan
Attractive economics with significant long-term exploration upside potential
- After-tax net present value (“NPV”) (5%) of
$428 million (base case gold price assumption of$1,675 per ounce and USD/CAD foreign exchange rate of$0 .75:1) - After-tax internal rate of return (“IRR”) of 17%
- After-tax NPV (5%) of
$670 million , and an after-tax IRR of 22%, at current gold prices of approximately$1,950 per ounce - Payback of less than four years at the base case gold price of
$1,675 per ounce and less than three years at current gold prices
Significant near-mine and regional exploration upside potential
- The
Lynn Lake project encompasses most of the east-trending, 125 km long,Lynn Lake Greenstone Belt in northwesternManitoba , with a total of 58,000 hectares of mineral tenure, representing significant exploration potential, including:- Gordon deposit: higher-grade gold mineralization extended outside of Mineral Reserves and Resources in the northeastern extent of the planned Gordon pit, in an area modeled as waste in the 2023 Study
- Burnt Timber and Linkwood: potential for smaller, higher-grade Mineral Resource that could be trucked and processed at the planned MacLellan mill later in the mine life
- Regional targets: extensive pipeline of highly prospective exploration targets at various stages of exploration across the
Lynn Lake greenstone belt. This includes the Maynard and Tulune targets where ongoing drilling continues to intersect gold mineralization. Both targets are within trucking distance of the MacLellan mill
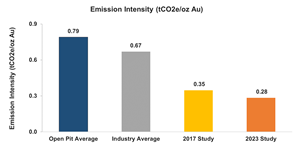
- 18% decrease in GHG emissions per ounce from the 2017 Study reflecting the incorporation of electric shovels and drills at MacLellan, and productivity improvements with the larger operation
- 58% lower emissions per ounce produced than the industry average. The project will be connected to Manitoba’s electric grid, of which nearly all electricity is produced from clean, renewable power, supporting the company-wide target of a 30% reduction in absolute GHG emissions by 2030
Fully funded growth
- As outlined previously, the Company does not anticipate spending any significant capital on developing the
Lynn Lake project until the Phase 3+ Expansion at Island Gold is well advanced - With
$189 million of cash as ofJune 30, 2023 , no debt, strong ongoing free cash flow generation, and significant free cash flow growth expected from Island Gold in 2026 and beyond, the Company is well positioned to fund development ofLynn Lake internally
“The 2023 Study has confirmed
“Our current priority is the Phase 3+ Expansion at Island Gold with
| 2023 Feasibility Study Highlights | |
| Production | |
| Mine life (years) | 16.5 |
| Total gold production (000 ounces) | 2,185 |
| Total silver production (000 ounces) | 2,623 |
| Average annual gold production | |
| Years 1 to 5 (000 ounces) | 207 |
| Years 1 to 10 (000 ounces) | 176 |
| Years 1 to 16 (000 ounces) | 135 |
| Total ore mined (000 tonnes) | 47,607 |
| Total waste mined (000 tonnes) | 324,215 |
| Total material mined (000 tones) | 371,822 |
| Total waste-to-ore ratio | 6.81 |
| Average gold grade (grams per tonne) | 1.52 |
| Average silver grade (grams per tonne) | 3.57 |
| Gold Recovery (%) | 93.7% |
| Silver Recovery (%) | 48.0% |
| Average mill throughput (tpd) | 8,000 |
| Operating Costs | |
| Total cost per tonne of ore (C$)1 | |
| Total cash cost (per ounce sold)2,3 | |
| Mine-site all-in sustaining cost (per ounce sold)2,3 | |
| Years 1 to 5 (per ounce sold) | |
| Years 1 to 10 (per ounce sold) | |
| Years 1 to 17 (per ounce sold) | |
| Capital Costs (millions) | |
| Initial capital expenditure | |
| Sustaining capital expenditure | |
| Reclamation costs | |
| Total capital expenditure – life of mine | |
| Total capital expenditure (per ounce sold) – life of mine3 | |
| Base Case Economic Analysis: (USD/CAD foreign exchange rate of | |
| IRR (after-tax) | 17% |
| NPV @ 0% discount rate (millions, after-tax) | |
| NPV @ 5% discount rate (millions, after-tax) | |
| Payback (years) | 3.7 |
| Economic Analysis at (USD/CAD foreign exchange rate of | |
| IRR (after-tax) | 22% |
| NPV @ 0% discount rate (millions, after-tax) | |
| NPV @ 5% discount rate (millions, after-tax) | |
| Payback (years) | 2.7 |
- Total unit cost per tonne (“t”) of ore includes royalties and silver as a by-product credit
- Total cash costs and mine-site all-in sustaining costs include royalties and silver as a by-product credit
- Please refer to the Cautionary Notes on non-GAAP Measures and Additional GAAP Measures
Mineral Reserves and Resources
An updated Proven and Probable Mineral Reserve totaling 47.6 mt, grading 1.52 g/t Au and 3.57 g/t Ag, containing 2.3 million ounces of gold and 5.5 million ounces of silver has been declared at
Mineral Reserves – Effective as of
| Classification | Tonnage (000’s) | Au Oz Contained (000’s) | Ag Oz Contained (000’s) | |||
| MacLellan | Proven | 16,498 | 1.66 | 5.31 | 883 | 2,815 |
| Probable | 23,240 | 1.12 | 3.55 | 834 | 2,650 | |
| Proven & Probable | 39,738 | 1.34 | 4.28 | 1,717 | 5,464 | |
| Gordon | Proven | 3,502 | 2.63 | - | 296 | - |
| Probable | 4,370 | 2.27 | - | 319 | - | |
| Proven & Probable | 7,873 | 2.43 | - | 615 | - | |
| Proven | 20,000 | 1.83 | 4.38 | 1,179 | 2,815 | |
| Probable | 27,610 | 1.30 | 2.98 | 1,153 | 2,650 | |
| Total Proven and Probable | 47,610 | 1.52 | 3.57 | 2,332 | 5,464 | |
- Mineral Reserves reported are consistent with the CIM Definition Standards for Mineral Resources and Mineral Reserves.
- Mineral Reserves are reported to a cut-off grade of 0.796 Au g/t at Gordon and 0.355 Au g/t for MacLellan.
- The cut-off grades are based on a gold price of
US$1,250 /oz Au at Gordon,US$1,600 /oz Au at MacLellan. - Silver is not used in the cut-off grade calculation.
- Metallurgical Au recovery is 92.4% for Gordon and a feed grade-based formula for MacLellan.
- Totals may not add up due to rounding.
Chris Bostwick , FAusIMM, Senior Vice President, Technical Services is the Qualified Person for the Mineral Reserve estimate.Mr. Bostwick is a Qualified Person within the meaning ofCanadian Securities Administrator's National Instrument 43-101 ("NI 43-101").
Mineral Resources for the Gordon and MacLellan deposits detailed below have not been included in the mine plan but represent potential upside through their incorporation into the mine plan with higher metal prices and additional infill drilling.
Open Pit Mineral Resources – Effective as of
| MacLellan | ||||||
| Category | Tonnage (000’s) | Au oz Contained (000’s) | Ag oz Contained (000’s) | |||
| Measured | 786 | 1.63 | 3.09 | 41 | 78 | |
| Indicated | 3,200 | 1.52 | 3.44 | 156 | 354 | |
| Measured & Indicated | 3,986 | 1.54 | 3.37 | 197 | 432 | |
| Inferred | 4,192 | 0.98 | 1.49 | 133 | 201 | |
| Gordon | ||||||
| Category | Tonnage (000’s) | Au oz Contained (000’s) | Ag oz Contained (000’s) | |||
| Measured | 571 | 0.84 | - | 15 | - | |
| Indicated | 1,286 | 1.2 | - | 50 | - | |
| Measured & Indicated | 1,857 | 1.09 | - | 65 | - | |
| Inferred | 51 | 0.98 | - | 2 | - | |
| Total | ||||||
| Category | Tonnage (000’s) | Au oz Contained (000’s) | Ag oz Contained (000’s) | |||
| Measured | 1,357 | 1.29 | 1.79 | 56 | 78 | |
| Indicated | 4,486 | 1.43 | 2.45 | 206 | 354 | |
| Measured & Indicated | 5,843 | 1.4 | 2.3 | 262 | 432 | |
| Inferred | 4,243 | 0.98 | 1.47 | 134 | 201 | |
- Mineral Resources reported are consistent with the CIM Definition Standards for Mineral Resources and Mineral Reserves.
The Mineral Resources are reported at an assumed gold price ofUS$1,600 /oz, and an assumed silver price ofUS$23.00 /oz.- Mineral Resources are not Mineral Reserves and do not have demonstrated economic viability. There is no certainty that all or any part of the Mineral Resources estimated will be converted into Mineral Reserves.
- Open pit Mineral Resources are stated as contained within a potentially economic open pit above a 0.355 g/t AuEq cut-off for MacLellan and 0.621 g/t Au for Gordon and includes external dilution at zero grade outside the constraining Au solids.
- Contained Au and Ag ounces are in-situ and do not include metallurgical recovery losses.
- Mineral Resources are exclusive of Mineral Reserves.
- Totals may not add up due to rounding.
Jeffrey Volk , CPG, FAusIMM, Director of Reserves and Resources forAlamos Gold Inc is the Qualified Person for the Mineral Resource estimate.Mr. Volk is a Qualified Person within the meaning ofCanadian Securities Administrator's National Instrument 43-101 ("NI 43-101").
Economic Analysis
Lynn Lake’s estimated base case after-tax IRR is 17% and after-tax NPV (5%) is
Assuming spot gold prices of approximately
Lynn Lake’s economics were estimated as part of the Feasibility Study process and incorporate only Proven and Probable Mineral Reserves. The project economics are sensitive to metal price assumptions, foreign exchange, and input costs as detailed in the tables below.
Lynn Lake After-Tax NPV (5%) Sensitivity ($ Millions)
| -10% | -5% | Base Case | 5% | 10% | ||
| Gold Price | $427.9 | |||||
| Canadian Dollar | $427.9 | |||||
| Capital Costs | $427.9 | |||||
| Operating Costs | $427.9 | |||||
Lynn Lake After-Tax NPV (5%) and IRR Sensitivity to Gold Price
| Gold Price ($/oz) | After-Tax NPV5% ($M) | After-Tax IRR (%) | ||
| 12.6% | ||||
| 14.8% | ||||
| $1,675 | $427.9 | 16.6% | ||
| 18.2% | ||||
| 20.3% | ||||
| 22.4% | ||||
Project Overview
The
The 2023 Study includes a number of scope changes from the 2017 Study to support a larger operation and 44% increase in Mineral Reserves. The scope changes include a larger mobile fleet to support the higher mining rates, and a larger mill with a 14% increase in throughput rates to 8,000 tpd. The larger operation and Mineral Reserve support a significantly longer mine life of 17 years and a 23% increase in average annual production over the first 10 years.
Project Significantly De-Risked Given Advanced Level of Engineering, Permitting and other Geotechnical Work Completed to Date
Since the 2017 Study, a significant amount of additional work has been completed and progress made on the
- Basic engineering 100% complete with detailed engineering underway and 55% complete
- Geotechnical investigations, including drilling and test pitting, to support designs for the MacLellan and Gordon pits, waste stockpiles, tailings dam, process plant, site access roads, and water management infrastructure
- Geophysical (
Ground Penetrating Radar ) investigations completed to map bedrock depth beneath the process plant infrastructure - Mill relocated to reduce the haulage distance, allow site access via the existing road, reduce the overall footprint of the site, improve the construction schedule, reduce the flood risk, and minimize the amount of earthworks needed due to the elevated topography and shallow bedrock of the chosen location
- With EIS approval received in
March 2023 , the 2023 Study incorporates the design and costs associated with the EIS process and Provincial licenses/Federal Decision Statement and associated Conditions, including for:- Fugitive air emissions
- Noise
- The management of acid-generating and potentially acid generating material
- Site reclamation and restoration
- Surface and groundwater, vegetation and wildlife monitoring and reporting
- Contact and noncontact water management including the use of lined water collection ponds at both sites
Mining – Expanded
Relative to the 2017 Study, mining rates have been accelerated over the initial five years of the operation to support access to higher grades earlier in the mine life. The Gordon and MacLellan deposits will be developed using conventional shovel/truck open pit mining methods, with owner mining to be employed over the mine life. Concurrent mining of the Gordon and MacLellan deposits is planned for the first five years, with a two-year pre-production period at MacLellan and one year at Gordon included in capital. Given its higher grades, mining at Gordon will be accelerated with the deposit to be depleted after five years. As the Gordon pit nears depletion, mining equipment will be transferred to MacLellan and utilized over the remainder of its mine life.
The mine plan includes total mining in the range of 4 to 49 million tonnes per annum (“Mtpa”) over 11 years of mining. This includes a peak mining rate of 16 Mtpa at Gordon and 33 Mtpa at MacLellan, up from peak rates of 13 Mtpa and 25 Mtpa, respectively in the 2017 Study. A larger mining fleet will be utilised at both sites to support the higher mining rates. This includes larger 23.5 m3 hydraulic shovels at MacLellan, versus 14 m3 in the 2017 Study, and 16 x 140 t trucks hauling ore, up from 13 trucks in the 2017 Study. A larger fleet of 12 x 70 t trucks will also be utilised at Gordon, compared to 7 x 144 t trucks in the 2017 Study. The larger fleet of smaller trucks will allow for more selective mining.
At MacLellan, two drills and the two 23.5 m3 hydraulic shovels will be electric, lowering operating costs as well as reducing the operation’s carbon footprint. Ore from Gordon will be transported 55 kilometres to the MacLellan mill utilizing 43 t side dump trailers, up from 30 t trucks in the 2017 Study, resulting in fewer trucks on the road. The Company will continue to evaluate opportunities to further electrify the fleet of mobile equipment.
Processing and Infrastructure – Larger,
Lynn Lake’s process plant has been designed as a conventional milling operation with a nominal capacity of 8,000 tpd. The proposed plant design is based on leach/carbon in pulp (“CIP”), and will consist of crushing, grinding, thickening, pre-aeration and leaching, CIP, cyanide detoxification, carbon elution and regeneration, and gold smelting. The size of the mill has been expanded from 7,000 tpd in the 2017 Study with a number of scope changes to support the 14% higher throughput rates. The primary crusher dump pocket has been optimized in order to have dual dump capacity, providing improved reliability and efficiency. The size of, and power to the SAG mill and ball mills have also been increased to accommodate the higher throughput rate. The fine ore storage area will consist of steel bins with apron feeders versus a covered stockpile in the 2017 Study. This will provide improved dust control, operability, and reliability. The plant layout has been optimized and two extra tanks have been added to the leach circuit, increasing circuit retention time, and thereby improving recovery.
The flow sheet incorporates the following major process operations:
- Two-stage crushing and crushed ore silo,
- Semi-autogenous grinding (SAG),
- Ball mill grinding and classification,
- Leaching and CIP adsorption,
- Desorption and gold room,
- Tailings detoxification and disposal,
- Fresh and reclaim water supply, and
- Reagent preparation and distribution
Mill recoveries are expected to average 93.7% for gold and 48% for silver over the life of mine. This is up from 92.0% recovery for gold and consistent with the 49% recovery expected for silver in the 2017 Study. The increase in gold recovery reflects optimizations to the mill with two additional tanks added to the leach circuit providing increased circuit retention time, as well as an increased proportion of MacLellan ore which has higher recoveries than Gordon.
Power to the MacLellan site, which will host all the process facilities and major infrastructure, will be supplied from Manitoba Hydro through the commercial electricity grid. The existing power line to the
The tailings management facility (“TMF”) will be constructed approximately 2 km northeast of the planned open pit and plant site at MacLellan. Additional dam raises are planned for years two, six and 12 to accommodate the life of the mining operation. The majority of operational water required for the process plant will be reclaimed from the TMF.
Electric shovels and drills will be utilized within the MacLellan open pit, and the operation will be connected to Manitoba’s electric grid, of which nearly all electricity is produced from clean, renewable power. Combined with productivity improvements through the larger operation, this is expected to drive an 18% reduction in GHG emissions per ounce relative to the 2017 Study. This will further reduce Lynn Lake’s GHG emission intensity which is expected to be 58% below the industry average and 65% below the open pit average.
Source:
Operating Costs
Total cash costs are expected to average
Over the life of mine, mine-site all-in sustaining costs have increased 9% from the 2017 Study with the larger, more efficient operation and economies scale offsetting the majority of cost inflation, and lower average grades over a 44% larger Mineral Reserve.
Total operating costs are expected to average
The breakdown of unit costs is summarized as follows.
| Operating Costs1 | C$/t | LOM US$M | |||
| Mining2 | C$/t mined | ||||
| Mining2 | C$/t ore | ||||
| Haulage (Gordon ore)3 | C$/t ore | ||||
| Processing | C$/t ore | ||||
| G&A | C$/t ore | ||||
| Refining, Transport, Royalties and | C$/t ore | ( | ( | ||
| TOTAL Operating Costs | C$/t ore | $44.21 | $1,578.7 | ||
| Total Cash Costs4 | US$/oz | $722 | |||
| Mine-site All-in Sustaining Costs4 | US$/oz | $814 | |||
- Operating costs exclude working capital
- Average mining cost per tonne is for the production years
- Haulage costs are reported per total tonne of ore from the Gordon deposit – average haulage cost is
C$1.56 per tonne of total ore processed - Please refer to the Cautionary Notes on non-GAAP Measures and Additional GAAP Measures
Royalty
There is a capped third-party royalty on a portion of production. Based on a
Capital Costs
The initial capital cost for the
Camp infrastructure to accommodate the workforce will be located on-site and will be utilized throughout the construction and operations phases.
Combined initial and sustaining capital is expected to total
A breakdown of the capital requirements is detailed as follows.
| Capital Cost ($ Millions) | ||
| Mining Infrastructure | ||
| Pre-production Mining | ||
| Mobile Equipment (Initial Lease Payments) | ||
| Process Plant | ||
| Utilities and Services | ||
| Onsite Infrastructure | ||
| Offsite Infrastructure | ||
| Tailings Management | ||
| Indirects | ||
| EPCM | ||
| Owner's Cost | ||
| Contingency | ||
| $631.8 | ||
| Sustaining Capital | ||
| Reclamation and Closure Costs | ||
| Total Capital | $832.4 | |
Taxes
The
Permitting
In
In
The Mathias Colomb Cree Nation has brought an application for judicial review of the Decision Statement issued by the
Given the increase in Mineral Reserves, the Company will be submitting a notification of alteration for the EIS while pursuing other project related permits.
Additional Opportunities
Incorporating Burnt Timber and Linkwood Mineral Resource, Exploration success to date, and significant regional potential
The
The
Near-mine exploration - Gordon Deposit
Exploration drilling results received after
- 11.19 g/t Au over 10.40 m (5.87 m true width) (22GDX082);
- 2.51 g/t Au over 25.10 m (17.30 m true width) (22GDX081); and
- 2.86 g/t Au over 10.59 m (7.74 m true width), and 4.72 g/t Au over 5.35 m (3.55 m true width) (22GDX080).
1Drillhole composite intervals reported as “cut” include higher grade samples which have been cut to 40 g/t Au at the Gordon deposit.
Burnt Timber and Linkwood Deposits - geological evaluation of deposits identifies potential for smaller higher-grade Mineral Resource within trucking distance of MacLellan mill, with potential for expansion of mineralization
The Burnt Timber and Linkwood deposits contain Inferred Mineral Resources totaling 1.6 million ounces grading 1.1 g/t Au (44.4 million tonnes “mt”) as of
Updated deposit-scale geological models have now been completed for the Burnt Timber and Linkwood deposits, demonstrating excellent potential for a smaller, higher-grade Mineral Resource that could provide additional ore to the MacLellan mill. In addition, there is signficant potential to expand near-surface gold mineralization at both deposits.
Burnt Timber and Linkwood are connected by an existing all-season road to the planned MacLellan site and mill. The deposits are being evaluated as an additional source of ore feed once mining activities are completed in year 11 with the depletion of the MacLellan pit. This represents additional upside potential to the 2023 Study.
The updated deposit-scale geological models will form the basis for infill drilling at both deposits in 2024, as well as to evaluate the potential to expand gold mineralization outside of currently defined Mineral Resources.
In 2022, six holes totalling 1,516 m were completed at the Burnt Timber gold deposit with highlights announced earlier this week as follows:
- 2.48 g/t Au over 5.91 m (5.35 m true width) (22BTX050);
- 0.89 g/t Au over 13.52 m (12.35 m true width) (22BTX053); and
- 1.22 g/t Au over 8.72 m (7.99 m true width (22BTX054).
Maynard Regional Target
The Maynard target is located 8 km northwest of the Burnt Timber deposit, 5 km northwest of the Linkwood deposit, and 20 km by road from the proposed MacLellan mill. Maynard, represents a high-priority target as a potential satellite deposit within trucking distance of the MacLellan mill.
As announced earlier this week, significant gold mineralization has been extended over a 700 m strike length and to a depth of 280 m at Maynard. To date, all 16 holes drilled within the Maynard target have intersected gold mineralization. Highlights announced earlier this week include2:
- 5.87 g/t Au over 11.88 m, including 13.81 g/t Au over 2.80 m, and 20.29 g/t Au over 1.22 m (23LLX066);
- 1.01 g/t Au over 56.90 m, including 6.09 g/t Au over 2.50 m (22LLX031);
- 2.63 g/t Au over 13.00 m, including 39.70 g/t Au over 0.73 m, and 0.80 g/t Au over 16.00 m, and 0.58 g/t Au over 23.15 m (22LLX027);
- 0.68 g/t Au over 40.13 m (22LLX028); and
- 1.09 g/t Au over 23.75 m, including 4.72 g/t over 4.01 m (22LLX030).
2Gold grades reported as uncut, composite intervals reported as core length, true width is unknown at this time.
Tulune Regional Target
Tulune is a greenfields discovery made in 2020, and is located between the Gordon and MacLellan deposits. Ongoing drilling has extended broad zones of near surface gold mineralization over a 1.5 km strike length, including in a 350 m step out hole to the east. Assay results are pending from the 2023 drill program at Tulune, however, all 29 holes drilled within the granite and granodiorite prior to 2023 have intersected gold mineralization. Highlights from the 2022 drilling program include2:
- 1.12 g/t Au over 23.00 m (22LLX059);
- 1.08 g/t Au over 16.10 m, including 34.30 g/t Au over 0.30 m (22LLX054); and
- 0.75 g/t Au over 21.90 m (22LLX060).
Updated interpretations and additional targeting will be completed at Tulune once the results have been received from the 2023 program. Drilling results to date have demonstrated a significant gold system, with gold mineralization intersected in every drill hole over a 1.5 km strike within the felsic intrusive. The focus for future targeting will be continuing to define and test a variety of structural and lithological settings with the objective of defining higher-grade mineralization within this newly discovered gold system.
2Gold grades reported as uncut, composite intervals reported as core length, true width is unknown at this time.
Consultant Contributions
The Lynn Lake Feasibility Study was consolidated by Alamos Gold’s technical team in collaboration with the following third party consulting firms in their respective areas of expertise:
Worley Canada Inc. : Process plant and general infrastructure design and costingAGP Mining Consultants Inc. : Open pit design and mine plan, equipment selection, open pit capital and operating costsStantec Consulting Ltd. : Support for environmental planning, assessment, licensing, and permitting- WSP Canada Inc.: Tailings management facility design, geotechnical investigations, pit slope design, water management design
Project Background
The
The MacLellan mine was formerly operated as an underground gold and silver mine between 1986 and 1989. The Gordon site, historically referred to as the
Technical Disclosure
The Company will file a technical report prepared in accordance with NI 43-101 on SEDAR at www.sedar.com within 45 days of the date of this release.
About Alamos
Alamos is a Canadian-based intermediate gold producer with diversified production from three operating mines in
FOR FURTHER INFORMATION, PLEASE CONTACT:
| Senior Vice President, Investor Relations |
| (416) 368-9932 x 5439 |
The TSX and NYSE have not reviewed and do not accept responsibility for the adequacy or accuracy of this release.
Cautionary Note
This news release contains or incorporates by reference “forward-looking statements” and “forward-looking information” as defined under applicable Canadian and
Forward-looking statements in this news release include, but may not be limited to, information as to strategy, plans, expectations or future financial or operating performance pertaining to, or anticipated to result from, the
Exploration results that include geophysics, sampling, and drill results on wide spacings may not be indicative of the occurrence of a mineral deposit. Such results do not provide assurance that further work will establish sufficient grade, continuity, metallurgical characteristics and economic potential to be classed as a category of Mineral Resource. A Mineral Resource that is classified as "Inferred" or "Indicated" has a great amount of uncertainty as to its existence and economic and legal feasibility. It cannot be assumed that any or part of an "Indicated Mineral Resource" or "Inferred Mineral Resource" will ever be upgraded to a higher category of Mineral Resource. Investors are cautioned not to assume that all or any part of mineral deposits in these categories will ever be converted into Proven and Probable Mineral Reserves.
The Company cautions that forward-looking statements are necessarily based upon several factors and assumptions that, while considered reasonable by management at the time of making such statements, are inherently subject to significant business, economic, technical, legal, political, and competitive uncertainties, and contingencies. Known and unknown factors could cause actual results to differ materially from those projected in the forward-looking statements, and undue reliance should not be placed on such statements and information.
Such factors include (without limitation): the actual results of current and future exploration activities; changes to current estimates of mineral reserves and mineral resources; conclusions of economic and geological evaluations; changes in project parameters as plans continue to be refined; the speculative nature of mineral exploration and development; risks in obtaining and maintaining necessary licenses, permits and authorizations for the Company’s development stage and operating assets; operations may be exposed to new diseases, epidemics and pandemics, including any ongoing or future effects of COVID-19 (and any related ongoing or future regulatory or government responses) and its impact on the broader market and the trading price of the Company's shares; provincial and federal orders or mandates (including with respect to mining operations generally or auxiliary businesses or services required for operations) in
For a more detailed discussion of such risks and other risk factors that may affect the Company's ability to achieve the expectations set forth in the forward-looking statements contained in this news release, see the Company’s latest 40-F/Annual Information Form and Management’s Discussion and Analysis, each under the heading “Risk Factors” available on the SEDAR website at www.sedar.com or on EDGAR at www.sec.gov. The foregoing should be reviewed in conjunction with the information, risk factors and assumptions found in this news release.
The Company disclaims any intention or obligation to update or revise any forward-looking statements whether as a result of new information, future events or otherwise, except as required by applicable law.
Market data and other statistical information used in this news release, such as the reference to
Cautionary Note to U.S. Investors
Alamos prepares its disclosure in accordance with the requirements of securities laws in effect in
Investors are cautioned that while the above terms are “substantially similar” to CIM Definitions, there are differences in the definitions under Regulation S-K 1300 and the CIM Standards. Accordingly, there is no assurance any mineral reserves or mineral resources that the Company may report as “proven mineral reserves”, “probable mineral reserves”, “measured mineral resources”, “indicated mineral resources” and “inferred mineral resources” under NI 43-101 would be the same had the Company prepared the mineral reserve or mineral resource estimates under the standards adopted under Regulation S-K 1300. U.S. investors are also cautioned that while the
Cautionary non-GAAP Measures and Additional GAAP Measures
Note that for purposes of this section, GAAP refers to IFRS. The Company believes that investors use certain non-GAAP and additional GAAP measures as indicators to assess gold mining companies. They are intended to provide additional information and should not be considered in isolation or as a substitute for measures of performance prepared with GAAP.
“Cash flow from operating activities before changes in non-cash working capital” is a non-GAAP performance measure that could provide an indication of the Company’s ability to generate cash flows from operations and is calculated by adding back the change in non-cash working capital to “cash provided by (used in) operating activities” as presented on the Company’s consolidated statements of cash flows. “Cash flow per share” is calculated by dividing “cash flow from operations before changes in working capital” by the weighted average number of shares outstanding for the period. “Free cash flow” is a non-GAAP performance measure that is calculated as cash flows from operations net of cash flows invested in mineral property, plant and equipment and exploration and evaluation assets as presented on the Company’s consolidated statements of cash flows and that would provide an indication of the Company’s ability to generate cash flows from its mineral projects. “Mine site free cash flow” is a non-GAAP measure which includes cash flow from operating activities at, less capital expenditures at each mine site. “Return on equity” is defined as earnings from continuing operations divided by the average total equity for the current and previous year. “Mining cost per tonne of ore” and “cost per tonne of ore” are non-GAAP performance measures that could provide an indication of the mining and processing efficiency and effectiveness of the mine. These measures are calculated by dividing the relevant mining and processing costs and total costs by the tonnes of ore processed in the period. “Cost per tonne of ore” is usually affected by operating efficiencies and waste-to-ore ratios in the period. “Total capital expenditures per ounce produced” is a non-GAAP term used to assess the level of capital intensity of a project and is calculated by taking the total growth and sustaining capital of a project divided by ounces produced life of mine. “Total cash costs per ounce”, “all-in sustaining costs per ounce”, “mine-site all-in sustaining costs”, and “all-in costs per ounce” as used in this analysis are non-GAAP terms typically used by gold mining companies to assess the level of gross margin available to the Company by subtracting these costs from the unit price realized during the period. These non-GAAP terms are also used to assess the ability of a mining company to generate cash flow from operations. There may be some variation in the method of computation of these metrics as determined by the Company compared with other mining companies. In this context, “total cash costs” reflects mining and processing costs allocated from in-process and doré inventory and associated royalties with ounces of gold sold in the period. Total cash costs per ounce are exclusive of exploration costs. “All-in sustaining costs per ounce” include total cash costs, exploration, corporate and administrative, share based compensation and sustaining capital costs. “Mine-site all-in sustaining costs” include total cash costs, exploration, and sustaining capital costs for the mine-site, but exclude an allocation of corporate and administrative and share based compensation. “Adjusted net earnings” and “adjusted earnings per share” are non-GAAP financial measures with no standard meaning under IFRS. “Adjusted net earnings” excludes the following from net earnings: foreign exchange gain (loss), items included in other loss, certain non-reoccurring items, and foreign exchange gain (loss) recorded in deferred tax expense. “Adjusted earnings per share” is calculated by dividing “adjusted net earnings” by the weighted average number of shares outstanding for the period.
Additional GAAP measures that are presented on the face of the Company’s consolidated statements of comprehensive income and are not meant to be a substitute for other subtotals or totals presented in accordance with IFRS, but rather should be evaluated in conjunction with such IFRS measures. This includes “Earnings from operations”, which is intended to provide an indication of the Company’s operating performance and represents the amount of earnings before net finance income/expense, foreign exchange gain/loss, other income/loss, and income tax expense. Non-GAAP and additional GAAP measures do not have a standardized meaning prescribed under IFRS and therefore may not be comparable to similar measures presented by other companies. A reconciliation of historical non-GAAP and additional GAAP measures are detailed in the Company’s latest Management’s Discussion and Analysis available online on the SEDAR website at www.sedar.com or on EDGAR at www.sec.gov and at www.alamosgold.com.
Table 1:
| Mining - Gordon | |||||||||||||||||||||
| Ore Mined (000 tonnes) | - | - | 6 | 790 | 1,631 | 2,946 | 1,679 | 817 | - | - | - | - | - | - | - | - | - | - | - | - | - |
| - | - | 3.08 | 2.11 | 2.36 | 2.36 | 2.34 | 3.33 | - | - | - | - | - | - | - | - | - | - | - | - | - | |
| Waste Mined (000 tonnes) | - | - | 4,389 | 14,210 | 14,369 | 13,054 | 8,623 | 2,628 | - | - | - | - | - | - | - | - | - | - | - | - | - |
| Mining - MacLellan | |||||||||||||||||||||
| Ore Mined (000 tonnes) | - | 67 | 520 | 4,286 | 7,507 | 2,729 | 1,090 | 1,875 | 2,781 | 4,611 | 5,381 | 4,503 | 2,726 | 1,663 | - | - | - | - | - | - | - |
| - | 0.92 | 0.92 | 1.38 | 1.41 | 1.31 | 1.02 | 1.04 | 1.20 | 1.28 | 1.26 | 1.36 | 1.70 | 1.79 | - | - | - | - | - | - | - | |
| - | 2.95 | 2.95 | 5.25 | 4.49 | 3.69 | 3.30 | 2.89 | 3.22 | 3.59 | 4.17 | 4.83 | 5.19 | 5.49 | - | - | - | - | - | - | - | |
| Waste Mined (000 tonnes) | - | 4,170 | 12,931 | 19,714 | 25,493 | 30,271 | 31,910 | 31,125 | 30,219 | 28,389 | 26,310 | 15,873 | 7,832 | 2,704 | - | - | - | - | - | - | - |
| Processing - | |||||||||||||||||||||
| - | - | - | 2,259 | 2,920 | 2,920 | 2,920 | 2,920 | 2,920 | 2,920 | 2,920 | 2,920 | 2,920 | 2,920 | 2,920 | 2,920 | 2,920 | 2,920 | 2,920 | 1,548 | - | |
| - | - | - | 2.55 | 3.07 | 2.85 | 1.96 | 1.91 | 1.52 | 1.71 | 1.71 | 1.69 | 1.56 | 1.23 | 0.74 | 0.73 | 0.87 | 0.53 | 0.52 | 0.52 | - | |
| - | - | - | 5.42 | 5.50 | 2.51 | 1.69 | 2.21 | 2.20 | 3.60 | 5.25 | 5.70 | 4.83 | 4.30 | 3.36 | 3.18 | 3.55 | 2.48 | 2.39 | 2.41 | - | |
| Au Production (000 oz) | - | - | - | 175 | 272 | 250 | 171 | 167 | 133 | 151 | 152 | 150 | 137 | 109 | 65 | 64 | 76 | 46 | 45 | 24 | - |
| Ag Production (000 oz) | - | - | - | 189 | 248 | 113 | 76 | 99 | 99 | 162 | 236 | 257 | 218 | 194 | 151 | 143 | 160 | 112 | 108 | 58 | - |
| Operating Costs | |||||||||||||||||||||
| Mining (C$/tonne mined) | - | - | - | - | - | - | - | - | - | - | |||||||||||
| Haulage (C$/tonne of Gordon ore processed) | - | - | - | - | - | - | - | - | - | - | - | - | - | - | - | - | |||||
| Milling (C$/tonne processed) | - | - | - | - | |||||||||||||||||
| G&A (C$/tonne processed) | - | - | - | - | |||||||||||||||||
| Total Cash Costs (US$/oz) 1,2 | - | - | - | - | |||||||||||||||||
| Mine-site AISC (US$/oz) 1,2 | - | - | - | - | |||||||||||||||||
| Capital Expenditures | |||||||||||||||||||||
| - | - | - | - | - | - | - | - | - | - | - | - | - | - | - | - | - | - | ||||
| Sustaining Capital and Reclamation (US$M) | - | - | - | - | - | - | - | - | |||||||||||||
| Total Capital (US$M) | - | - | - | - | - | ||||||||||||||||
1 Please refer to Cautionary Notes on non-GAAP Measures and Additional GAAP Measures.
2 Total cash costs and mine-site all-in sustaining costs are inclusive of silver credits, royalties, and refining costs while unit operating costs are reported exclusive of these costs
Figure 1: Lynn Lake District Map

![]()
Annual Gold Production (oz Au)

Annual Gold Production (oz Au)
Emission Intensity (tCO2e/oz Au)
Emission Intensity (tCO2e/oz Au)
Figure 1: Lynn Lake District Map

Figure 1: Lynn Lake District Map
2023 GlobeNewswire, Inc., source
