Talking Points:
- Misleading Pin Bar on AUD/JPY Daily Chart
- 2 Resistance Zones Clearly in Play Now
- Where and When to Consider AUD/JPY Shorts
One of the more popular strategies for end-of-day trading involves the pin bar, which many use to great effect. However, today's intraday trade actually highlights a pin bar breakout on the AUDJPY daily chart that may not work out as well as longer-term traders may hope.
As shown below, the pin bar high has just been broken on the daily chart, and price appears to be happily on its way. However, there are two clear horizontal ranges in play on this time frame, and price is about to retest a roof. It may or may not break to the topside from here, but intraday traders could take their chances with countertrend trades here nonetheless.
Guest Commentary: 2 Daily Ranges in Play for AUD/JPY
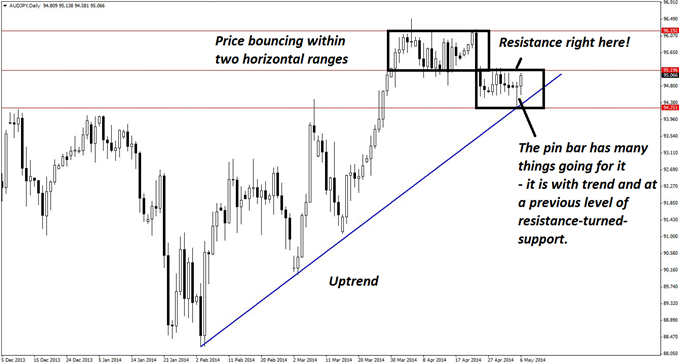
If price reacts—and recent candles have reacted to this level many times—then there is at least potential for a scalp here, one that could turn into a longer-term trade if price heads lower. There are 70 pips to be had even to reach the rising trend line below, and if it breaks, it would signify a shift in the somewhat dubious-looking uptrend comprised of many overlapping swings.
The lower portion of the resistance zone on the four-hour chart (see below) is obvious, as it is simply the level that has recently held as resistance.
Guest Commentary: Key Resistance Zone for Selling AUD/JPY
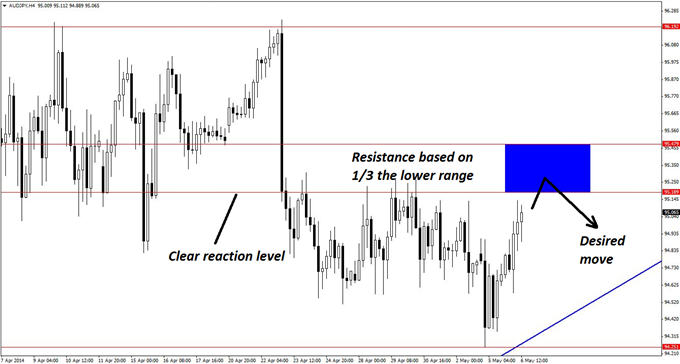
To provide some room for error, a value approximately one-third of the current horizontal range has been added to the topside, giving an overall resistance zone of 95.18-95.47. This zone is 29 pips deep, which is a little large compared with the (conservative) potential 70-pip move to the trend line.
As a result, the better idea would be to trade this set-up using a trigger from the hourly chart, shown below. There are a lot of overlapping moves here, which suggests that the current upward move is being consistently challenged by sellers and is most likely not a trend move.
Guest Commentary: Ideal Time Frame for Taking This Trade
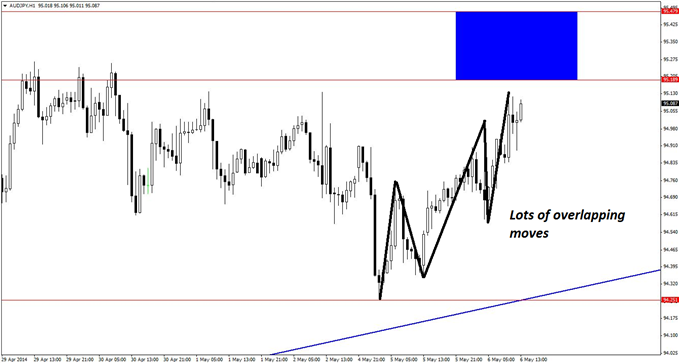
With that in mind, once AUDJPY touches resistance, short entries could be made using bearish engulfing patterns, pin bars, and/or bearish reversal divergence on this hourly time frame. As always, however, two or three attempts may be needed in order to successfully hop on to this move.
By Kaye Lee, private fund trader and head trader consultant, StraightTalkTrading.com
original source


