Platinum : Sensitive to risk aversion
By Oscar Salza
The metal is mainly used in the automotive industry, and especially for the manufacture of catalytic converter for diesel vehicles. This industrial absorbed 38% of world production in 2011. Therefore, platinum’s demand is highly related to economic conditions. However, is increasingly replaced by palladium, cheaper and easier to find. The jewelry sector is also become an important consumer of this metal, in fact platinum jeweleries are increasingly popular in emerging markets, especially in China and India.
In period of economic normality platinum is traded with a premium compared to gold, due to its rarity. The ratio between these two metals has always been in a range 1.6 and 2.4. Since 2008, follow the economic turmoil and increased risk aversion on financial markets, this ratio was reversed. Since last September, this trend is become more important, when European debts’ fear pushed the gold to its peak, and had reduced the ratio between two metals at its lowest 0.866. From this level, the platinum re-established its natural trend, increasing by 18%, while the gold metal is stabilized. Thus, the ratio is returned above psychological level of 1. Renewed confidence on risk assets could help the platinum to outperform the gold in the next months. Also fundamental reasons might confirm the platinum’s hegemony. At first the high production costs, then the strike sets up by Rustenburg’s mine workers in South Africa, one of the largest in the world, and which reduced the annual production about 2%.
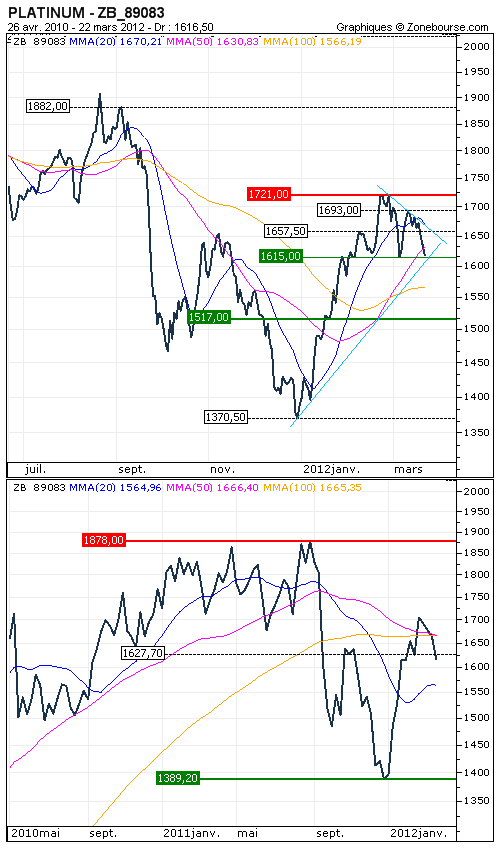
Technically, the trend in weekly data remains neutral, as is evidenced by 50 and 100 periods moving averages. The 1625 USD area is a pivot point, from which could start a new bullish or bearish impulsion.
In daily data, the upward acceleration started in early 2012 has met a real obstacle in the area of 1720 USD. We are now back on the 1615 USD support and these oscillations have formed a bullish triangle.
Therefore, we must pay attention to this technical pattern, monitoring the upward exit from this triangle, which could have as first target 1760 USD, and then 1875 USD. A stop loss could be set at 1590 USD, in order to cover the position.


