Daily
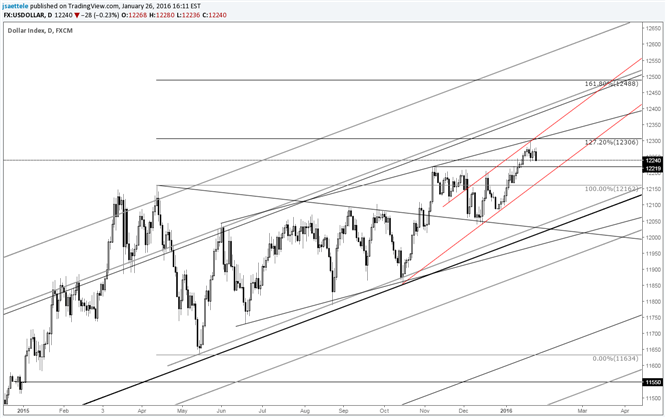
Chart Prepared by Jamie Saettele, CMT
Automate trades with Mirror Trader and see ideas on other USD crosses
-The last update noted that “the index broke has broken out of a 2 month inverse head and shoulders continuation pattern. The trend is higher as long as above trendline support (red line) but 12280-12300 may slow the advance.” The high so far is 12300. Given the daily reversal bar (on 1/21) and longer term momentum profile (divergence with RSI on the weekly), this could end up as a market top.
For more analysis and trade setups (exact entry and exit), visit SB Trade Desk
original source


