
For two years, capex on exploration and development has fallen off the table with the inevitable result that the inventory glut that previous existed would be worked off. For many consecutive weeks now, there have been record-setting drawdowns such that the industry has been eating its assets in order to meet demand. Recent drawdowns have amounted to some 78 million barrels, soon to be 100 million barrels according to analysts at Raymond James & Associates. In the next few months, we anticipate the “news” of shortages.
As the global GDP is growing at a rate of some 4% annually, the demand for oil is continuously increasing. To invest in exploration drilling sufficient to build the industry reserves, the companies require sustainable profitability. The joint ministers of the OPEC and non-OPEC producing countries that have a pact to cut production and deliveries until prices reach into the 60s, are steadfast with their rebalancing program.
Yes, there is talk of shale production that can produce a profit at $50/barrel; but these are costly and rapidly depleting wells. Industry economics is such that for five consecutive weeks (and 7 of the last 10) there has been a reduction in the number of active oil drill rigs in North America, including 16 this week in Canada; so obviously shale is not the answer.
The only answer is $65 oil. In fact, the industry itself, as well as the world’s largest private equity players, have been actively acquiring reserves based on the inevitability of higher crude oil prices to come. An example of that is the purchase by Cardinal Energy of Apache’s Canadian oil assets (approx. 5,000 barrels of oil equivalent per day, boepd) for US$244 million, including US$74 million borrowed from banks. 2Q2017 Cardinal production averaged 17,154 boepd, but the market cap today, now looking at a forecasted 21,000 boepd for 2H2017, is just approx. US$378 mil. So, with the industry valuing the 5,000 boepd at US$244 mil, the market is giving a value of just US$134 mil for the 17,154 boepd production of 1H2017.
So, who is right, the company and its bankers or Wall Street? We can go through deal after deal to show the same dichotomous relationship between industry and Wall Street pricing.
Our working associate Harp Singh of Harp Investments has this to say about algo’s: “I have closely observed the trading mechanism of automated trading platforms over the past four years and found them to exacerbate the degree of distortion that is typical between economically driven supply and demand in the real economy and technically driven supply and demand in exchange traded markets. Such extreme price distortion in turn presents a great opportunity for the deep value investor who does proper analysis and is patient.”
Our last point is particularly important. Producing nations today are complaining that there are in fact two oil markets. One is based on fundamental economics the industry must live by in order to stay in business and the other on computer trading algorithms used to control prices of futures contracts and stock exchange prices that Wall Street has been living by since the global financial system crash in 2007-2008. The industry has been forced into a death spiral for many of its constituent companies and the same is true even for nations like Venezuela.
However, we all know that the world needs increasing amounts of oil, so it’s important to understand what’s really happening versus what people on Wall Street are telling you is happening, that you should join the crowd and profit in the short run at the oil industry’s expense.
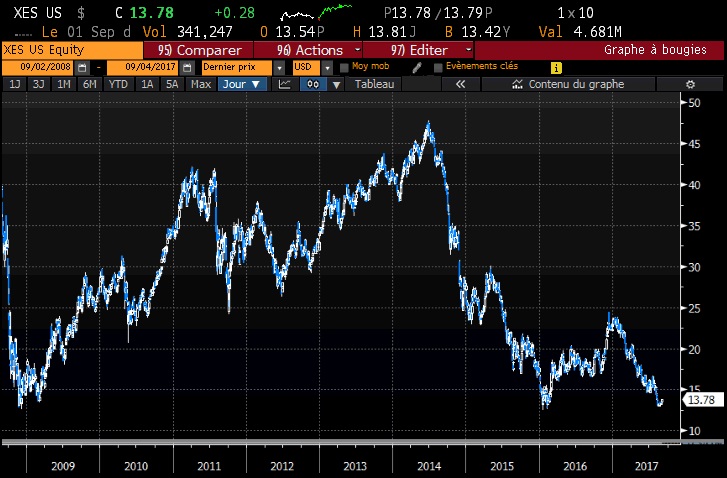
If you look at 10-year price charts of oil and gas companies, you will see that most are at long-cycle lows. Below is the popular S&P Oil & Gas Equipment & Services index (XES). In combination with our WTI oil price movement forecast, we believe there is downside probability to the highest quality stocks in the oil sector given the economic development for the past 2.5 years.
If you also study the balance sheets of the best managed of these companies, you will see valuable assets that analysts and investors are giving little to no value to.
We have closely examined the finances and operations of ten companies that we consider to be well managed:
- Baytex Energy
- Canadian Natural Resources
- Cardinal Energy
- Devon Energy
- EnCana Corp
- MEG Energy
- Spartan Energy
- TORC Oil & Gas
- Tourmaline Oil
- Seven Generations Energy
Among the companies on my list there is a strong Great North presence (i.e., Canada) for a reason. For the most part, these are explorers and developers of conventional heavy oil and natural gas resources that have been most negatively impacted by the media stories of an oil glut caused by low-cost US shale production. When reality sets in, however, crude oil prices will lift and these are ten companies that stand to gain much more than others in terms of revaluation of their reserves.
One, Devon Energy (DVN), is only traded on the NYSE, while three others, Baytex Energy (BTE), EnCana Corp (ECA) and Canadian Natural Resources (CNQ) are dually-listed on the TSX and NYSE. Six others, Cardinal Energy (CJ), MEG Energy (MEG), Spartan Energy (SPE), Torc Oil & Gas (TORC), Tourmaline (TOU) and Seven Generations (VII), are only TSX listed, although some also trade OTC in the US.
We own shares of three of the ten companies, BTE, CJ and MEG, but may soon be buying shares in all of them because they are, in our view, all solid companies whose assets will soon be repriced at much higher levels.
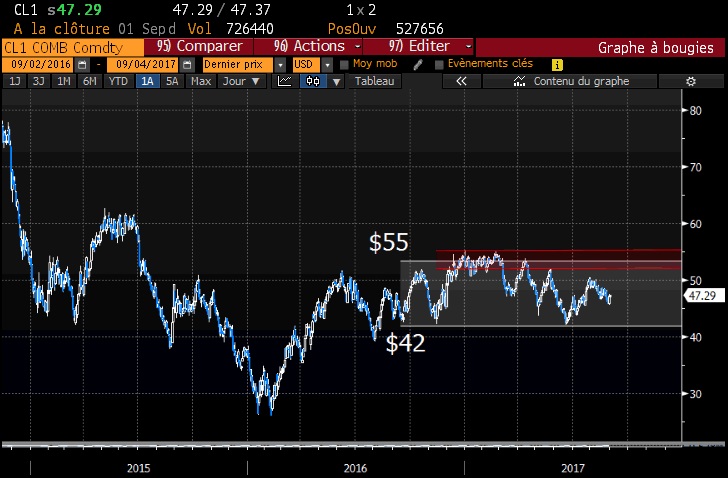
We all choose holdings for different reasons. In our case, we look at opportunities in capital markets as a private equity investor would: For the oilers, we believe the reserve revaluations to come are more important than today’s cash flow and earnings, and even finances. We have invested in Baytex, Cardinal and MEG because we believe the upside is greatest following the move in WTIC prices into the 60s and we are not unduly concerned about their financial condition. These companies are operating well within their banking agreement provisions and will for the period of time that supply and demand is rebalanced in the industry and capital market prices stabilize at a mid-point of say $65/barrel, fluctuating for the most part between $55 and $75 in the years ahead.
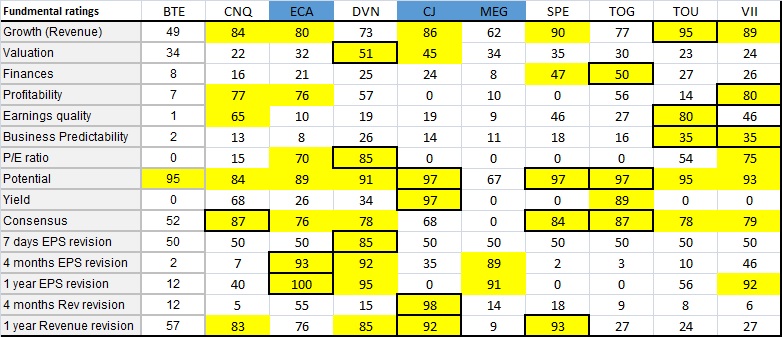
Using a fundamental and technical screen from Thomson Reuters and 4-Traders.com, we can tell you that BTE and MEG are achieving very low rankings on this list and CJ is presently held in disfavor because of the Apache deal. But as we like them all, we believe that share prices of each will increase from 2x up to 10x before the end of the current Bull market in global equities.
Briefly there are 15 fundamental ranking criteria and 6 technical rankings we reviewed using data at the close on August 30 (Thursday).
Fundamental Rankings:
-
Revenue Growth, which is based on the evolution of the turnover of the company between the last year and the three coming years according to consensus estimates. The higher the growth is (from a relative viewpoint), the better the rating is. The goal is to rank companies according to estimated sales and to identify companies with the highest growth.
- Winners: TOU, SPE and VII
- Losers: BTE, MEG and DVN
- Valuation, which is based on the ratio between enterprise value and its turnover for the current fiscal year and the next one. The lower the valuation is, the better the rating is. The goal is to rank companies according to valuation and to identify companies with the lowest valuation.
- Winners: only DVN with CJ behind it
- Losers: TOU and VII
- Finances, which is based on the evolution of the net debt of the company (debt or cash) and its EBITDA, compared to its revenue. The higher the cash is, the better the rating is. The goal is to rank companies according to financial situation and to identify companies with the highest growth. The goal is to rank companies according to the quality of their financial situation.
- Winners: TOG followed by SPE, but noting than none of the ten are in superb shape.
- Losers: BTE and MEG, which is what is scaring investors away. If BTE goes bankrupt, so does Saudi Arabia, so you can forget that.
- Profitability, which is based on net margin of the company for the current year and the next one according to consensus estimates. The higher the ratio is, the better the rating is. The goal is to rank companies according to the “Net income/revenue” ratio to identify those which have a high payoff.
- Winners: VII, CNQ and ECA
- Losers: CJ and SPE
- Earnings Quality, which is based on quality of past earnings released by the company compared to analysts’ estimates. The better earnings release is, the higher the rating is. The companies closest to the consensus will have an average score. The goal is to identify companies that publish regularly above consensus.
- Winners: TOU followed well behind by CNQ
- Losers: BTE and MEG
- Business Predictability, which is based on the dispersion of analysts' estimates on the evolution of the company business in the coming years (range estimates). The more estimates are concentrated, the more the rating is high. The goal is to rank companies according to the predictability of their business and identify companies whose business is highly predictable.
- Winners: TOU and VII, but neither is good
- Losers: BTE, ECA and MEG
- Price Earnings Ratio, which compared the company’s current share price to its per-share earnings for the current fiscal year and the next one. The lower the PER is, the better the rating is. The goal is to rank companies according to their earnings multiples and identify those which are cheap.
- Winners: DVN, VII and ECA
- Losers: BTE, CJ, MEG, SPE and TOG (lots of companies losing money at current oil prices)
- Upside Price Potential, which is based on the average target price fixed by the consensus from Thomson Reuters. The higher the target price is, the better the rating is. The goal is to identify companies that have, according to analysts, the strongest upside potential.
- Winners: CJ, SPE and TOG followed closely by BTE and TOU (all with enormous potential)
- Losers: none really, but MEG is lowest ranked
- Yield, which is based on the dividend relative to its share price. The higher the dividend yield is, the better the rating is. The goal is to identify companies that can supply a significant dividend return to their shareholders.
- Winners: CJ and TOG
- Losers: many of them, including BTE, MEG, SPE, TOU and VII (preserving capital is best)
- Consensus, which is based on analyst recommendations. It provides an indication of the position taken by most analysts polled by Thomson Reuters. The goal is to identify companies that benefit from the maximum of buy (or sell) recommendations.
- Winners: CNQ and TOG, followed closely by SPE
- Losers: MEG is by far the worst, but one we definitely favor
- EPS revisions (one week), which is based on the evolution of EPS (earnings per share) revisions of the company for the current fiscal year and the next one. During the last week, more EPS estimates are revised upward (from a relative point of view), the more rating is high. The goal is to rank companies according to analyst estimates and to identify companies with the best EPS estimates.
- Winners: only DVN reported and it was positive
- Losers: not applicable as none of the others reported last week
- EPS revisions (four months), which is based on the evolution of EPS (earnings per share) revisions of the company for the current fiscal year and the next one. During the last four months, more EPS estimates are revised upward (from a relative point of view), the more rating is high. The goal is to rank companies according to analyst estimates and to identify companies with the best EPS estimates. The difference is that the period of observation is based on fourth month instead of one week.
- Winners: ECA, DVN and MEG
- Losers: BTE, SPE, TOG and CNQ
- EPS revisions (one year), which is based on the evolution of EPS (earnings per share) revisions of the company for the current fiscal year and the next one. The more EPS estimates are revised upward (from a relative point of view), the more rating is high. The goal is to rank companies according to analyst estimates and to identify companies with the best EPS estimates. The difference is that the period is three times as long as EPS revisions (four months).
- Winners: ECA, DVN, VII and MEG
- Losers: CJ, SPE and TOG
- Revenue revisions (four months), which is based on the evolution of revenue revisions of the company for the current fiscal year and the next one. The more revenue estimates are revised upward (from a relative point of view), the more rating is high. The goal is to rank companies according to analyst estimates and to identify companies with the best revenue estimates.
- Winners: only CJ
- Losers: CNQ, VII, TOU and TOG
- Revenue revisions (one year), which is based on the evolution of revenue revisions of the company for the current fiscal year and the next one. The more revenue estimates are revised upward (from a relative point of view), the more rating is high. The goal is to rank companies according to analyst estimates and to identify companies with the best revenue estimates. The difference is that the period is three times as long as Revenue revisions (four months).
- Winners: SPE, CJ, DVN and CNQ
- Losers: MEG
Technical Rankings:
- Short Term Timing, which is defined according to the positioning of the last closed trading price, within the area between the short-term support and resistance on the basis of technical analysis in daily data. A high score indicates the stock will be close to its short-term support and away from short term resistance. Conversely, a low score indicates the stock will be close to its short-term resistance and away from its short-term support.
- Winners: CNQ
- Losers: BTE and VII
- Mid-Term Timing, which is defined according to the positioning of the last closed trading price, within the area between the mid-term support and resistance on the basis of technical analysis in daily data. A high score indicates the stock will be close to its mid-term support and away from mid-term resistance. Conversely, a low score indicates the stock will be close to its mid-term resistance and away from its mid-term support.
- Winners: ECA and CJ
- Losers: TOU and VII
- Long Term Timing, which is defined according to the positioning of the last closed trading price, within the area between the long-term support and resistance on the basis of technical analysis in daily data. A high score indicates the stock will be close to its long-term support and away from long term resistance. Conversely, a low score indicates the stock will be close to its long-term resistance and away from its long-term support.
- Winners: CJ, BTE, TOG and DVN
- Losers: MEG
- RSI rating, which is based on the ranking of the security in the panel studied according to the mathematical indicator RSI 14 period. The more the rating is high, the more the stock is in oversold position. Conversely, if the rating is low, it indicates a relative overbought situation.
- Winners: TOU
- Losers: MEG
- Bollinger Bands rating, which is based on the ranking of the security in the panel studied according to the spread of the Bollinger bands. The higher the rating is, the closer Bollinger bands are. Thus, prices are in an indecision area that could cause an upwards or downwards acceleration. Conversely, the lower the rating is, the wider Bollinger Bands are and recent volatility is significant.
- Winners: CNQ, TOU, VII, ECA and CJ
- Losers: BTE and DVN
- Abnormal Volumes rating, which is based on the ranking of the security in the panel studied according to volume of the last session compared to an average session. The more the rating is high, the more volumes were unusually high. Conversely, the more the rating is low, the more volume were unusually low.
- Winners: CJ, TOG, CNQ, TOU and MEG
- Losers: ECA and VII

Quantitative data analysts are mesmerized by these studies. They love to show you a plethora of data in typical Wall Street fashion for the purpose of selling you their firm’s positions, based mostly on the public’s use of technical analysis. In our case, however, the data is studied for outliers that may reflect opportunities that need to be considered from an investment perspective. Overall, the use of Big Data is part of our research and decision-making process. More important is the study of corporate presentations, latest financial reports and Management Discussion & Analysis (MD&A) of the companies on our watch list.
Next week, we plan to review from our investor perspective one or two of these ten companies to explain in detail why they could easily double, triple or lift in price much more than that in the next year.


