Clouds multiplied this week over stock markets: the ECB will raise its rates in July, the World Bank and the OECD lowered their growth forecasts and US inflation reached a 40-year high in May. There is no shortage of reasons to justify the debacle of financial markets over the past few sessions. The appetite for risk has faded very quickly, leading to a clear sell-off in most sectors. Only energy stocks are surviving, as oil prices remain at their recent highs. Indexes should continue to move in a volatile manner in the coming sessions, especially with the Fed meeting on rates next Wednesday.
Weekly variations*
DJ INDUSTRIAL
31392.79  -4.58%
Chart DJ INDUSTRIAL
NASDAQ 100
11832.82  -5.70%
Chart NASDAQ 100
FTSE 100
7317.52  -2.86%
Chart FTSE 100
GOLD
1871.76$  +1.09%
Chart GOLD
WTI
120.20$  -0.05%
Chart WTI
EURO / US DOLLAR
1.05$  -1.93%
Chart EURO / US DOLLAR
This week's gainers and losers

Gainers:

  • This week's top gainers include Biffa (+28%), the UK waste management specialist, which has received a takeover offer from Energy Capital Partners. It values the company at 1.36 billion pounds. 
  • U.S. listed E-commerce platform Pinduoduo (+16.13%) saw its share price soar after its activities in China resumed, following the lifting of health restrictions.
  • Kohl's Corp (+12.3%) the troubled US department store chain, has received a buyout offer from Franchise Group, for $60 a share. Exclusive negotiations are underway. 
  • UK-based manufacturing acquisition giant Melrose Industries (+16.5%) announced a €500 million share buyback program at its investor day. It also benefits from the favorable view of Citigroup. 
  • Gitlab (+9.5%), the U.S. bug-tracking software, soared on Tuesday, a day after the company reported a smaller-than-expected adjusted quarterly loss. The group raised its outlook for fiscal 2023. 


Losers:

  • The strategic review conducted by Zendesk (-27%), the software group, did not result in a buyout offer. Out of 26 expressions of intent, 10 resulted in further discussions but no convincing offer emerged. 
  • Docusign (-22.74%), the electronic signature specialist, fell due to challenges related to the post-pandemic context. It revised its guidance.
  • Amazon: The American e-commerce’s giant has drastically felt by 10.38% after being in the top’s gainer last week. The highest US-inflation for 40 years had a direct impact on tech companies. 
  • Autodesk is hit by inflation and shows a decrease of -10.90%.
Chart Commodities
Commodities
Highlights: The past week was positive for commodities markets, with the CRB Commodities Index rising 2% in just five days to 351 points. The energy sector continued to rise despite the stronger greenback.  

Oil: Oil prices are above USD 120 per barrel for Brent (USD 123) but also for WTI (USD 121). Prices remain weightless despite a new increase in crude oil inventories in the United States. Headlines this week remained dominated by the boycott of Russian oil, but operators also had the opportunity to focus on the monthly report of the EIA (the U.S. Energy Agency), which revised upward the U.S. production for 2022 and 2023. The latter should reach 11.92 million barrels per day (mbpd) in 2022 and 12.85 mbpd the following year.

Metals: The mood in precious metals is still gloomy, completely offset by rising bond yields. The return of risk aversion, which has been apparent in recent sessions, is not benefiting gold buyers. The barbarian relic is trading at around USD 1,843. Industrial metals, on the other hand, have gained some ground, boosted by the easing of restrictions related to the coronavirus in China. Lead is trading at USD 2200, copper is holding steady at USD 9600 while aluminum is gaining some ground at USD 2750.

Agricultural commodities: Corn prices rallied sharply in Chicago, as did wheat, but by a smaller margin. The market seems pessimistic about a potential return of Ukrainian supply to international markets. Ankara, which plays the role of mediator on the subject of Ukrainian exports, would like to open a grain corridor from the port of Odessa. Still in the register of soft commodities, the price of lumber continues to fall to 562 per thousand board feet.
Chart Commodities
Macroeconomics
Atmosphere: Investors' hearts are still swaying between the rather strong macroeconomic data and a more uncertain future as central banks tighten the screws on rates. Reduced liquidity is having an increasing impact on the real economy. Friday's release of higher-than-expected U.S. inflation in May put a coin back into the stagflation machine, especially since some investors were hoping for a continuation of the decline that began in April. For its part, the ECB paved the way for rate hikes that it refused to consider just a few months ago.

Rates: The ECB has hardened its stance, because it cannot remain unresponsive to the inflation rates that are hitting the continent. As a result, the interest rate on sovereign debt has risen, with the riskiest signatures rising faster, as they should. The 10-year debt is now paying 4.23% in Greece and 3.62% in Italy. Swiss debt varies less but is now flirting with 1%, half the rate of the French OAT (2%). The euro zone benchmark, the Bund, is at 1.41%. In the United States, the 5-year yield (3.13%) rose above that of the 10-year (3.05%) and the 30-year (3.12%) shortly after the announcement of inflation figures on Friday.

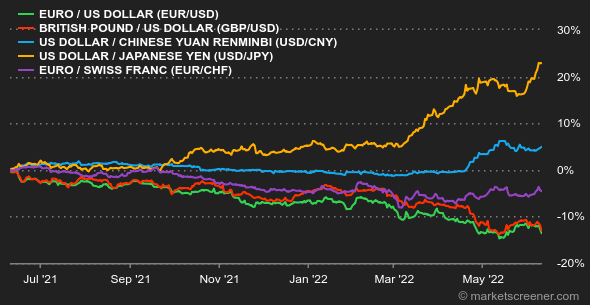
Currencies: The yen's record weakness continued to fall against the dollar, despite a small run by the Japanese currency at the end of the week. This is the price of the mismatch in strategy between a Fed resolutely committed to a rate hike cycle and a BOJ that has chosen not to move. A small incongruity on Friday: the Japanese political and monetary authorities were moved by the extent of the decline, which is quite rare. At that time, it took 133.35 JPY for 1 USD. Eight months ago, it was still JPY 110 to the USD. The euro/dollar pair remains stuck at its recent levels, between 1.06 and 1.07 USD per 1 EUR.

Cryptocurrencies: For bitcoin, the weeks have been one and the same for the past 1 month. The price has been languishing between $28,000 and $32,000, leaving crypto traders-investors wondering where the digital currency will go in the coming weeks. Although BTC ended a 9-week losing streak last Sunday, it could, in the medium term, continue to scare its aficionados in a macroeconomic context that is still not very favorable to risky assets. 

Calendar: A particularly busy week in the United States with producer prices (Tuesday) and retail sales (Wednesday), followed by the U.S. central bank's decision on its rates and monetary policy (Wednesday evening). The Bank of England will also be in the game on Thursday at midday. Both central banks are facing very high inflation issues that make monetary policy complex.
Historical Chart
Citius, Altius, Fortius
Faster, higher, stronger. That's the Olympic motto, but it could also be the currency of inflation right now. Inflation just set a new record last month at 8.6% year-over-year in the US. This figure has not been seen in 40 years. As the week comes to a close, the market looks like it will enter a new bearish wave, after a few weeks of rebound and lower volatility.
Things to read this week
The hidden side of fractional sharesThe hidden side of fractional shares
Some online trading platforms offer to invest in fractional shares, especially shares of large American technology companies with a high unit value . The... Read more
ETF overview: Oil & Gas, Health Technologies and Industrial ServicesETF overview: Oil & Gas, Health Technologies and Industrial Services
The health Care Select Sector SPDR Fund ETF : XLV seeks to provide investment results that correspond generally to the price and yield performance of the... Read more
What are stock splits good for?What are stock splits good for?
To start with, it is important to know that a split has absolutely no impact on the value of the company. It is like taking the same cake and dividing it into... Read more
*The weekly movements of indexes and stocks displayed on the dashboard are related to the period ranging from the open on Monday to the sending time of this newsletter on Friday.
The weekly movements of commodities, precious metals and currencies displayed on the dashboard are related to a 7-day rolling period from Friday to Friday, until the sending time of this newsletter. These assets continue to quote on weekends.