Talking Points:
- US Dollar at Risk as Prices Slip Below Key Support
- S&P 500 Hits 3-Week Low on Rising Selling Pressure
- Gold Aims Higher After Clearing Chart Resistance
Can’t access to the Dow Jones FXCM US Dollar Index? Try the USD basket on Mirror Trader. **
US DOLLAR TECHNICAL ANALYSIS – Prices broke support in the 10640-48 area marked by the bottoms of a range and a rising channel as well as the 23.6% Fibonacci retracement. Sellers now aim to challenge the 38.2% level at 10585, with a further push beneath that eyeing the 50% Fib at 10541. Reversing back above 10648 eyes the range top at 10718.

Daily Chart - Created Using FXCM Marketscope 2.0
** The Dow Jones FXCM US Dollar Index and the Mirror Trader USD basket are not the same product.
S&P 500 TECHNICAL ANALYSIS – Prices turned lower to test support at 1819.60, the 14.6% Fibonacci retracement. A break lower on a daily closing basis initially targets the 23.6% level at 1801.40. Near-term resistance is in the 1848.10-49.10 area, marked by the December 31 and January 10 swing highs.
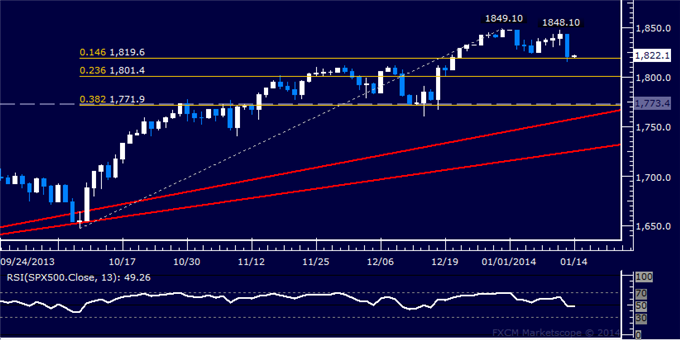
Daily Chart - Created Using FXCM Marketscope 2.0
GOLD TECHNICAL ANALYSIS – Prices turned higher as expected after putting in a Harami candlestick pattern. A break above resistance at 1248.70, the 38.2% Fibonacci expansion, has exposed the 1261.28-70.28 area (marked by bracketed by the October 11 swing low and the 50% level). A further push beyond that targets the 61.8% Fib at 1291.86. Turning back below 1248.70 aims for the 23.6% retracement at 1222.01.
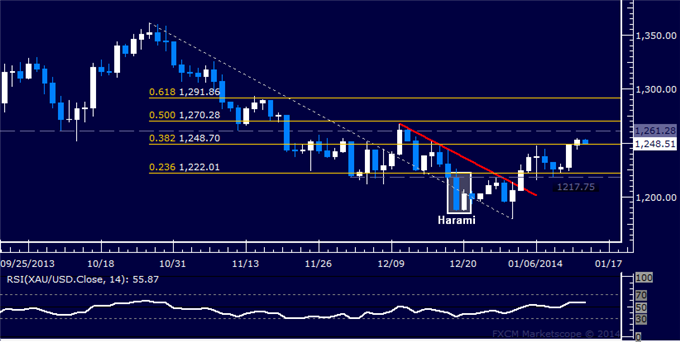
Daily Chart - Created Using FXCM Marketscope 2.0
CRUDE OIL TECHNICAL ANALYSIS– Prices fell as expected after putting in a Bearish Engulfing candlestick pattern. A break below 91.74 – the November 27 swing low – has exposed the 50% Fibonacci expansion at 90.50. A further push beneath that aims for the 61.8% level at 88.08. Reversing back above 91.74 and the 38.2% Fib at 92.91 aims for the 23.6% expansion at 95.90.
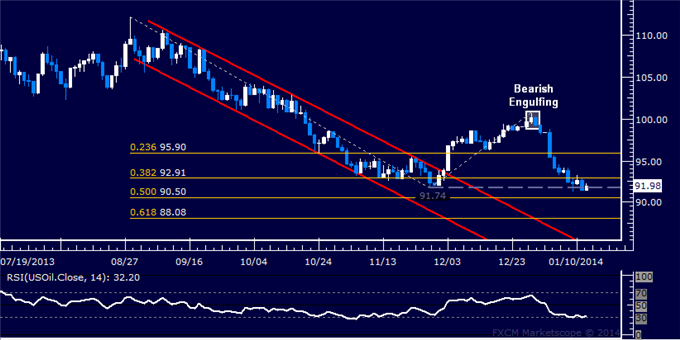
Daily Chart - Created Using FXCM Marketscope 2.0
--- Written by Ilya Spivak, Currency Strategist for DailyFX.com
To receive Ilya's analysis directly via email, please SIGN UP HERE
Contact and follow Ilya on Twitter: @IlyaSpivak
original source


