Access the concrete investment decisions that made us known.
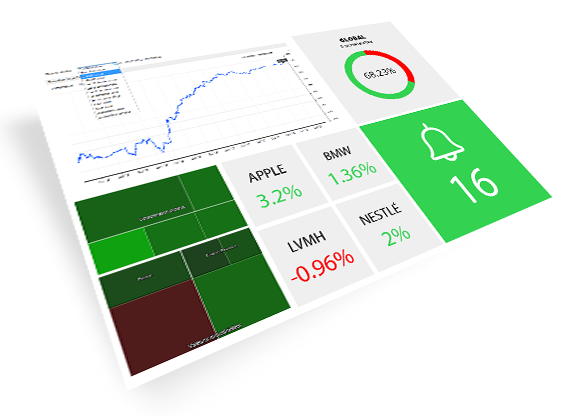
Follow our positions and the performance of our three well-managed portfolios on the markets - USA, Europe and Asia - with complete transparency. Our performances are real, net of brokerage fees and transaction taxes.
Our portfolios are made up of highly liquid companies.
The assets are allocated by country/sector to reduce risk.
You will be notified of each transaction we carry out.
On average, we make two transactions per month per portfolio
*Past performance is not a guarantee of future results.
A unique global database
Our database is the benchmark for discerning investors. Powered by the best sources, it covers all markets and all listed instruments. Whether you want to monitor your portfolio, track a sector, or are looking for new opportunities, our platform provides you with a comprehensive overview in one place.
Global quotes: stocks, indices, bonds, currencies, commodities, ETFs...
10-year company data: published, historical, and comparative accounts.
Analyst estimates and consensus: forecasts, revisions, surprises, and trends.
Dividends and yields: historical data and comparative analysis.
Breakdown of revenue by business activities and geographical areas.
Full agenda: company calendar and macroeconomic announcements.
Decision-makers and shareholders: bios, networks, and distribution.
Sector comparison: classifications, benchmarks, and cross-analysis.
Insider transactions: purchases and sales by executives.
Extra-financial: MSCI ESG rating and exclusive fundamental ratings from MarketScreener.
Leading financial media with unmatched depth of information
MarketScreener is the leading media platform for tracking financial markets. Benefit from our independence and expertise with a comprehensive, 360-degree view: stocks, ETFs, sectors, macro, indices, currencies, cryptocurrencies, commodities...
Used by millions of investors every month in more than 90 countries, our information service is recognized worldwide for its robustness, responsiveness, coverage, and added value.
Gain perspective with our articles, analyses, and insights written by our team of journalists, analysts, and scientists who are experts in the financial markets.
Follow the markets in real time with news feeds from the best global sources, available in seven languages and automatically translated for immediate reading.
Access the most comprehensive online database available. Benefit from unparalleled depth and breadth of information to track your stocks, your sectors, or to discover specific companies.
Access the summary work of our journalists who get up early and go to bed late to keep you reliably informed and save you time.
The MarketScreener experts produce analyses and advice on a daily basis. This allows you to discover or rediscover companies in which to invest or to avoid.
Written by our team of experts, our in-depth articles will help you make your decisions and understand ours.
We select quality companies, i.e. businesses that are growing which generate profits without relying excessively on debt, and whose stocks are trading at reasonable valuations given their advantages. They have attractive growth potential ahead.
We continuously monitor 70 investment themes that are making headlines or reflect underlying trends.
Find our stock lists in the form of portfolios with their performance, sector and geographical exposure. Each theme is explained in detail, and the lists of companies are updated very regularly.
Track your stocks or import your information to efficiently manage your investments thanks to our tools, databases, and news:
Create up to 10 lists of 50 stocks to track your favorite companies: real-time quotes, news, earnings releases, estimate changes, broker recommendations, and more.
Set up your alerts so you don't miss any information.
Like major investors and professional analysts, get closer to companies by accessing transcripts of earnings announcements, investor conferences, or presentations made by the company.
Each transcript is structured and organized to allow you to easily navigate between the comments of executives and questions from analysts or investors.
You will also find a positive content analysis and a ranking of the keywords used.
Always up to date and ideal for fundamental analysis and idea generation. For immediate use, for a meeting or as part of an investment committee, they can be printed, annotated, shared, and stored.
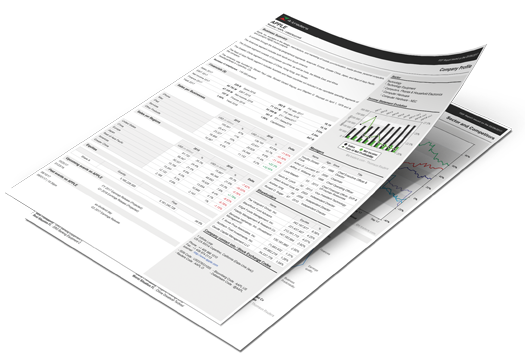
Available for download and covering more than 60,000 listed companies, the six-page summary reports contain all the detailed information you need and provide a comprehensive overview of each company:
The Access subscription is dedicated to demanding independent investors who are looking for news and data. Your Access subscription includes many benefits, including:
Unlimited browsing without ad blocking, with full unlimited access to all MarketScreener news, articles and analysis.
Free access to daily newsletters (Morning Meeting) and weekly newsletters (Weekly Market Update).
Free access to our investment guide that you can easily download from your MarketScreener account.
A customer service to help and support you.
Free access to MarketScreener's paid iPhone application.
Access to numerous thematic investment lists, lists of stocks specially designed for each management or investment style (growth stocks, discounted stocks, dividend stocks, quality stocks, ESG stocks, multibaggers, offensive stocks, dynamic stocks, etc.).
Access to more than 50 lists of stocks classified according to their sector of exposure or a particular theme (solar, wind, video games and sports, defense, hydrogen, internet, artificial intelligence, robotics, e-commerce, fintechs, blockchain, strategic or rare metals, etc.
Access to the most advanced Stock Screener on the market, you can rank and compare all companies
Exclusive company scoring (investment and trading score available via our Stock Screener) built according to numerous criteria (growth, valuation, long term EPS review, financial situation, profitability, publication and visibility, short term EPS review, etc.) allowing our clients to quickly identify those that we rank according to long or short term investments
Access to automatic generation of financial reports in PDF format on all listed companies worldwide Extensive access to customized lists (10 * 50 stocks) Extensive access to virtual portfolios (10 * 50 stocks) Access to hundreds of fundamental metrics
Fundamental data of institutional quality, we work with all the most reliable and recognized financial and stock market data providers in the world (Refinitiv, S&P Global, MorningStar, Factset, etc.)
What is included in my Premium membership?
The Premium subscription is dedicated to investors who wish to follow our opinions and decisions to accompany them on the stock market. Your Premium subscription includes many benefits:
All the tools, services and content of the Access subscription
Unlimited access to all the advice of our experts to help you optimize the performance of your investments
Access to the 3 US / EU / Asia portfolios really invested to follow and replicate our investments and help you beat the markets
Unlimited access to the most successfulStock Screener on the market, you can rank and compare all companies
Unlimited access to automatic generation of financial reports in PDF on all listed companies worldwide
Access to the Premium Newsletter
What is included in my Expert subscription?
The Expert subscription is dedicated to investors who are looking for decision-making tools for investment experts Your Expert subscription includes many benefits:
All the tools, services and content of the Premium subscription
Personalized telephone support,
Access to the Stock Screener Pro version
Access to the Event Screener
Unlimited access to the automatic generation of financial reports in PDF on all the world's listed companies as well as the possibility of customizing these financial report models
Extended access to personalized lists (50 * 500 stocks)
Extended access to virtual portfolios (20 * 100 stocks)
This formula will help you reach new heights in the performance of your investments and in the mastery and understanding of the market.
What justifies the price of your subscriptions?
MarketScreener offers precisely the best quantity, quality and price ratio.
Other companies may offer cheaper subscriptions, but none of them offer a service as complete as MarketScreener in terms of information, tools, analysis, advice, real invested portfolios, etc. MarketScreener offers the most complete service for investing in the stock market.
All the world'sstock market news liveExclusive
MarketScreener high value-addedcontent including our analysis and investment advice
An unparalleled database covering +99.9% of the world's listed companies
The best stock market analysis and screening tools, offering a complete panel for investing in the stock market
3 portfolios US, EU, Asia really invested to allow you to replicate our investments and our performance levels that outperform the world markets
Training to help you progress and better understand the markets
The most completestock market app on the market
MarketScreener offers users clear, user-friendly, quality and in-depth data so that you can outperform the market and become the type of investor you want to be.
How do you manage to offer so many tools and quality content?
All investors deserve to benefit from quality information based on reliable data. Because we have been in business since 2001, we have spent the last 20 years creating the tools we need to manage, monitor and analyze markets and make our portfolios grow. This iswhy our tools are so useful and efficient because they are based on the concrete needs of all informed investors. Related to the quality of our content, we have built up and expanded our teams of analysts and journalists to provide our clients with exclusive, high-quality content on a daily basis. At MarketScreener there is not a single member of the team who is not an expert in his or her field.
Will I be able to access MarketScreener from several platforms?
Yes. You can access marketscreener.com through the mobile and desktop sites, as well as the iOS mobile app (free with the Access plan).
With a single subscription, can I access all the editions (US, UK, CA, etc.)?
Each edition of our products is considered as a site in its own right, with its own exclusive content, adapted news, highlights (quotations, markets, etc.) adapted to each edition. Nevertheless, we offer all our members the possibility to access all our editions by logging in with the login and password of their original edition.
How many stocks, indices, quotations do you cover?
Access the most complete range of financial and stock market information on the market, covering more than 99.9% of the world's listed companies. Our ratings and analysis systems, both technical and fundamental, are updated daily on nearly 20,000 companies. We also cover nearly 10,000 ETFs and more than 280,000 indices, and all types of quotations (currencies, crypto, commodities, etc.).
Who is your data provider?
We work with all of the world's most trusted and recognized financial and stock market data providers such as Refinitiv, S&P Global, MorningStar, FactSet, and many others.
What should I do if I have issues with my subscription?
You can contact us at any time. Our customer service is available during business hours to answer all your questions. It is made up of real people and experts to help you use our site to optimize the performance of your investments.
What if I want to cancel my subscription?
If you wish to terminate your MarketScreener subscription, you can easily do so at any time, very swiftly via the "terminate" button available from "my account" > "my subscriptions".
What payment methods do you accept?
We currently accept any credit or debit card such as MasterCard, Visa, American Express, Gpay, Apple pay. We also accept PayPal. All payments are processed securely through Stripe or Paypal.
Which subscription gives me access to transcripts?
MarketScreener, as a media specialized in stock market news, gives access to many different types of content (articles, analyses, videos, training, transcripts, etc.). With a simple Access subscription you can access all the transcripts available on our site. Transcripts, an essential tool for the informed investor, will allow you to complete the in-depth analysis of a company beyond its income statement.
If my subscription ends, will I lose my data/list/portfolio?
In case of an expired subscription you will lose access to the tools and services related to your subscription package. However, your lists, portfolios...etc. are not deleted and you can access them again at any time with an active subscription.
How do I delete my account?
Because the control and management of your personal data is a central principle at MarketScreener you can at any time and very simply request the deletion of your account through our contact form > personal data > delete my personal data. As soon as possible our customer service will take care of the deletion of your account and you will receive by email the confirmation of this deletion
Have you got any other questions?
We hope you found the answers you were looking for. If you still have any questions, please contact our customer service team, made up of real people who are experts in finance or their respective fields and who are dedicated to providing high-quality answers to all your questions.
They are talking about us
Users' reviews
J
James D. Former Trader
For a fundamental investor, MarketScreener is a powerful tool: a stock screener to find the best stocks, financial data and very complete stock profiles. The portfolio tracking gives me ideas on who I can (or cannot) follow, and the articles are very well documented. I couldn't do without it anymore!
k
kirk flores
I was lucky to discover MarketScreener! A complete newbie, I learned a lot thanks to all the data and to a great team always available and listening. I think it's the best stock market site (powerful charts, all the news, the super powerful stockscreener, different technical analysis and tabs). Thank you Jordan, Nicolas, Anthony, Patrick and the whole team!
O
Osterman
It's the only financial media that allows you to reach professionals who strive to remain available. My teaching practices have evolved thanks to the support of Mr. DUFEE and have allowed me to renew my approach to teaching financial markets. The use of media transforms the traditional vision of the training of stock market professionals.
R
Ralph G. Small Caps Specialist
MarketScreener has become THE reference for news and knowledge on financial markets. A Bloomberg for everyone!
S
Scheibling
I am of course satisfied with MarketScreener, as I've been a regular reader for years. I think it's the best stock market website currently and very well done (powerful charts, all the news, the different technical analysis and tabs). I really appreciated your help about the expert charts, you took the time to explain me how to set up these new charts which I'm really thankful for.
C
CJ
Very comprehensive website, realtime quotes, news etc. Perfect to follow your investments.
M
Master44
Essential website to make the right decisions!
M
Mary Locke
I find at MarketScreener the financial news I need and I appreciate the column written every morning by Romain Fournier and also the portfolio report
J
Jojo
Good stock picks, a good coverage and available and competent people
Y
YOUNG Mason
Serious and well documented website. The charts are easily customizable.
B
Brenda Name VENDITTI
Since my purchase of BE semiconductor based on your stock pick advice I am satisfied, this company deserves to be recommended in the long term ... Thank you
d
dinamyt
Excellent stock market website. Customizable and very intuitive screeners. Complete stock profile and analysis of sectors. I highly recommend this site which is a must.
J
J. Lee
I like the richness of the content, the screener. The other features are great. For the rest, news is well presented and when you are looking for information you often find it.
H
Honegger
MarketScreener is today one of the most complete sites in terms of coverage of stock markets. It is full of stock exchange information, the pdf reports are very complete but I think you need to highlight your technical analysis a bit more.
W
Williams-Brown
I am quite satisfied with the MarketScreener website, so much news in one place! I think it is unique, and saves a lot of time which I appreciate.
A
Anderson
So much news! The webinars are very useful to better understand the tools; The opinions given and positions taken by MS on stocks seem to be legit;
K
Kacey MILLER
Perhaps the biggest source of stock market news. An extremely wide range of companies analyzed. Innovative Screeners with remarkable efficiency. Well done!
M
Michelle
This is the only site I have found that is so exhaustive. A quick search and you'll get everything you're looking for. I am just a little disappointed this year, I wish that your investor portfolios were better... I guess no one has a crystal ball, even the best of us!
*40% discount for any new subscription with annual payment made between September 7 and September 20, 2026 inclusive. Offer reserved for MarketScreener members with no current subscription. Discount valid on first payment only. On expiry, the subscription will be renewed at the normal rate, reduced by up to 20%. Cannot be combined with any other offer or promotion. Discount calculated on the basis of a monthly subscription for 12 months.
Slave
Select your edition
All financial news and data tailored to specific country editions